Rent vs. Buy by State in 2026: Price-to-Rent Ratios for All 50 States

Rent vs buy decisions look very different from one state to another because home values and rents do not move in lockstep. This 2026 comparison ranks all 50 states with a classical price-to-rent ratio, using June 2026 typical home values and a same-month rent benchmark. A lower ratio means home values are lower relative to annual rent, while a higher ratio means buying carries a larger price premium relative to renting.
The ranking is a screening tool, not a personal recommendation. A real rent or buy decision also depends on mortgage rates, down payment, property taxes, insurance, maintenance, transaction costs, investment alternatives, and how long you expect to stay.
Rent vs. Buy by State in 2026
The table ranks all 50 states from the lowest price-to-rent ratio to the highest. The home-value side uses June 2026 Zillow Home Value Index values for all homes in the middle tier. The rent side uses June 2026 state rent benchmarks compiled from Zillow ZORI metro data by Keeping Up With Inflation. The publisher describes the state figures as metro-weighted ZORI prints for each state, not a single statewide survey, so they should be treated as broad state benchmarks rather than direct statewide rental estimates.
Price-to-rent ratio = typical home value ÷ (monthly rent × 12).
| Rank | State | June 2026 Typical Home Value | June 2026 Monthly Rent Benchmark | Price-to-Rent Ratio |
|---|---|---|---|---|
| 1 | Mississippi | $198,428 | $1,466 | 11.28 |
| 2 | West Virginia | $182,704 | $1,188 | 12.82 |
| 3 | Louisiana | $217,968 | $1,292 | 14.06 |
| 4 | Alabama | $241,517 | $1,333 | 15.10 |
| 5 | Kentucky | $235,363 | $1,243 | 15.78 |
| 6 | Oklahoma | $225,437 | $1,189 | 15.80 |
| 7 | Florida | $378,126 | $1,963 | 16.05 |
| 8 | New Mexico | $321,186 | $1,632 | 16.40 |
| 9 | Michigan | $269,972 | $1,368 | 16.45 |
| 10 | Arkansas | $228,662 | $1,153 | 16.53 |
| 11 | South Carolina | $309,323 | $1,535 | 16.79 |
| 12 | Alaska | $400,659 | $1,958 | 17.05 |
| 13 | Connecticut | $455,424 | $2,187 | 17.35 |
| 14 | Texas | $302,999 | $1,395 | 18.10 |
| 15 | North Carolina | $340,430 | $1,567 | 18.10 |
| 16 | Nebraska | $284,464 | $1,297 | 18.28 |
| 17 | Delaware | $412,252 | $1,842 | 18.65 |
| 18 | Ohio | $251,502 | $1,122 | 18.68 |
| 19 | Vermont | $402,017 | $1,775 | 18.87 |
| 20 | Georgia | $335,358 | $1,469 | 19.02 |
| 21 | Hawaii | $836,741 | $3,635 | 19.18 |
| 22 | Pennsylvania | $294,099 | $1,267 | 19.34 |
| 23 | Iowa | $241,255 | $1,026 | 19.60 |
| 24 | Indiana | $262,265 | $1,111 | 19.67 |
| 25 | Wyoming | $372,526 | $1,568 | 19.80 |
| 26 | Rhode Island | $517,078 | $2,172 | 19.84 |
| 27 | Missouri | $271,597 | $1,138 | 19.89 |
| 28 | Nevada | $448,215 | $1,859 | 20.09 |
| 29 | Kansas | $252,794 | $1,041 | 20.24 |
| 30 | Maine | $424,107 | $1,730 | 20.43 |
| 31 | North Dakota | $293,556 | $1,180 | 20.73 |
| 32 | Maryland | $436,104 | $1,748 | 20.79 |
| 33 | Tennessee | $338,769 | $1,333 | 21.18 |
| 34 | Illinois | $298,871 | $1,161 | 21.45 |
| 35 | Arizona | $422,822 | $1,636 | 21.54 |
| 36 | Colorado | $543,435 | $2,096 | 21.61 |
| 37 | Virginia | $419,920 | $1,597 | 21.91 |
| 38 | South Dakota | $325,618 | $1,237 | 21.94 |
| 39 | New Jersey | $584,681 | $2,139 | 22.78 |
| 40 | Minnesota | $356,887 | $1,275 | 23.33 |
| 41 | New Hampshire | $522,944 | $1,864 | 23.38 |
| 42 | Wisconsin | $342,279 | $1,217 | 23.44 |
| 43 | Massachusetts | $672,867 | $2,356 | 23.80 |
| 44 | Montana | $476,115 | $1,648 | 24.08 |
| 45 | Utah | $541,692 | $1,856 | 24.32 |
| 46 | Idaho | $482,199 | $1,588 | 25.30 |
| 47 | Oregon | $504,432 | $1,653 | 25.43 |
| 48 | California | $775,549 | $2,361 | 27.37 |
| 49 | New York | $525,947 | $1,569 | 27.93 |
| 50 | Washington | $603,303 | $1,767 | 28.45 |
Source and methodology: Home values use June 2026 Zillow Home Value Index values for all homes in the middle tier, smoothed and seasonally adjusted. Monthly rent benchmarks come from the June 2026 Average Rent by State table published by Keeping Up With Inflation. The publisher describes its state figures as metro-weighted ZORI prints rather than a single statewide survey. Washington, D.C. is excluded because this article ranks the 50 states.
Key Takeaways From the State Rankings
Mississippi has the lowest price-to-rent ratio in this comparison at about 11.28. West Virginia follows at 12.82, then Louisiana at 14.06. In these states, typical home values are relatively low compared with the annual rent benchmark.
Washington has the highest ratio at about 28.45, followed by New York at 27.93 and California at 27.37. Oregon and Idaho also rank near the high end. These higher ratios mean home values are expensive relative to the rent benchmark, not that renting will always cost less over a household’s full time horizon.
The middle of the distribution is broad. The median state ratio is about 19.82, so a large group of states sits between the obvious low and high ends. That is one reason a simple ratio should be treated as a first-pass comparison rather than a final rent-versus-buy verdict.
The ranking also shows why state home prices and state rents need to be viewed together. Florida, for example, has a home value well above many lower-cost states, but its rent benchmark is also relatively high, which pulls its ratio down to about 16.05. Hawaii has the highest home value in the country in this dataset, but its unusually high rent benchmark results in a middle-range ratio of about 19.18.
For the underlying housing-cost datasets, see our Average Rent by State in 2026 and Average Home Price by State in 2026 rankings.
What Is the Price-to-Rent Ratio?
The price-to-rent ratio compares a home’s value with one year of rent. It is often used as a quick way to judge whether purchase prices are high or low relative to rental costs in the same market.
How to Calculate the Price-to-Rent Ratio
Divide the home value by 12 months of rent.
If a state’s typical home value is $300,000 and the monthly rent benchmark is $1,500, annual rent is $18,000. The price-to-rent ratio is therefore about 16.67.
The ratio does not tell you the monthly cost of owning that home. It ignores mortgage interest, down payment, property taxes, homeowners insurance, maintenance, closing costs, and other ownership expenses.
What a High or Low Ratio Can Suggest
A lower price-to-rent ratio means the purchase price is relatively low compared with annual rent. That can make buying look more competitive at the screening stage.
A higher ratio means the purchase price is relatively high compared with annual rent. That can make renting look more competitive before financing and ownership costs are modeled.
There is no universal cutoff that determines whether a household should rent or buy. Different analyses use different rule-of-thumb thresholds, and a complete financial comparison requires more variables than the price-to-rent ratio includes.
States Where Buying Is Relatively More Competitive
Mississippi, West Virginia, and Louisiana stand out with the three lowest ratios in the table. Each is below 15 in this calculation.
Mississippi combines a typical home value of about $198,428 with a June rent benchmark of about $1,466, producing a ratio of 11.28. West Virginia’s home value is lower at about $182,704, but its rent benchmark is also lower at about $1,188, resulting in a ratio of 12.82. Louisiana comes in at 14.06.
Alabama, Kentucky, Oklahoma, Florida, New Mexico, Michigan, and Arkansas round out the 10 lowest ratios. These states have different housing markets, incomes, tax systems, insurance costs, and local conditions, so their similar ratio positions should not be interpreted as identical affordability.
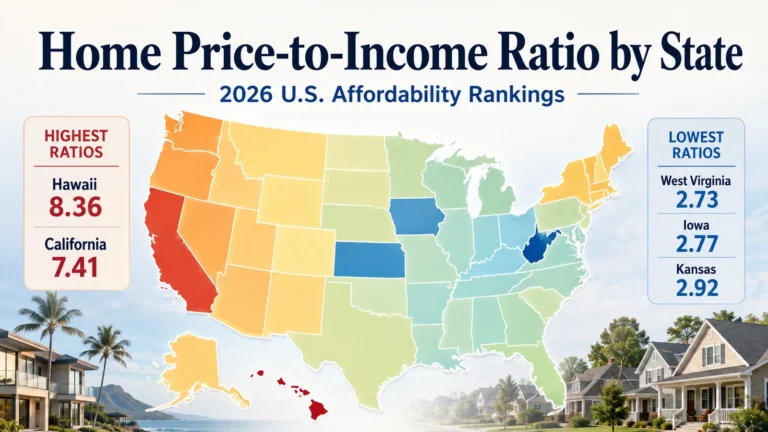
A low ratio can make the purchase price look attractive relative to rent, but it does not answer whether a household can qualify for a mortgage or comfortably carry the total monthly ownership cost. For that question, compare these results with our Home Price-to-Income Ratio by State in 2026 research.
States Where Renting Is Relatively More Competitive
Washington, New York, and California have the three highest price-to-rent ratios in this comparison. Their ratios range from about 27.37 to 28.45, meaning typical home values are more than 27 times the annual rent benchmark.
Oregon and Idaho are next, followed by Utah, Montana, Massachusetts, Wisconsin, and New Hampshire. In these states, the purchase-price premium relative to rent is larger than it is in most of the country.
That does not mean renting automatically wins over a long holding period. Buyers build equity, and future changes in home values, rents, mortgage rates, taxes, and insurance can materially change the comparison. But high-ratio states generally require a closer look at the cost of financing and the length of time a buyer expects to keep the home.
Why Price-to-Rent Ratio Is Not the Whole Rent-vs-Buy Decision
The price-to-rent ratio is useful because it is simple. Its weakness is also that it is simple.
Zillow’s current rent-versus-buy methodology models much more than home value and rent. It includes mortgage financing, property taxes, insurance, maintenance, closing costs, home equity, renter investment returns, and the time required for buying to reach a financial breakeven point. Zillow’s methodology illustrates why two households in the same market can reach different conclusions.
Mortgage Rates and Down Payment
Mortgage rates affect the monthly principal-and-interest payment on a financed home. As of August 27, 2026, Freddie Mac reported an average 6.66% rate for a 30-year fixed mortgage.
A higher down payment reduces the loan balance but requires more cash upfront. A lower down payment preserves cash but can increase borrowing costs and may introduce mortgage insurance. The price-to-rent ratio does not capture either tradeoff.
Property Taxes, Insurance, and Maintenance
Owners pay costs that renters generally do not pay directly as separate bills. These can include property taxes, homeowners insurance, maintenance, repairs, and homeowners association fees.
The Consumer Financial Protection Bureau notes that a mortgage payment alone can understate the real monthly cost of owning because taxes, insurance, mortgage insurance, association fees, and maintenance may also apply. CFPB recommends accounting for these additional costs when comparing options.
Those expenses can vary substantially by state and locality. A low price-to-rent ratio can therefore coexist with high insurance or tax costs.
Closing Costs and How Long You Plan to Stay
Buying and selling a home involve transaction costs. The shorter the holding period, the less time a buyer has to spread those costs across years of ownership.
That is why breakeven models focus heavily on time horizon. A household that expects to move in a few years faces a different calculation from a household that expects to stay for a decade or longer.
Opportunity Cost and Investment Returns
A renter may be able to invest cash that would otherwise go toward a down payment, closing costs, or a higher monthly ownership payment. A homeowner, meanwhile, builds equity as the mortgage balance falls and the home’s value changes.
The outcome depends partly on what each household actually does with the difference. A rent-versus-buy model that assumes disciplined investing will produce a different result from one that assumes unused cash is spent.
Lifestyle and Flexibility
The financial calculation is only part of the decision. Renting can offer easier mobility and fewer direct maintenance responsibilities. Buying can offer more control over the property, potential long-term housing stability, and equity accumulation.
Those preferences do not appear in a price-to-rent ratio.
Rent vs. Buy and Housing Affordability
Price-to-rent ratio and housing affordability are related, but they measure different things.
A low ratio tells you that home values are relatively low compared with rent. It does not tell you whether local incomes are high enough to support the purchase. A state can have a favorable price-to-rent relationship while still presenting substantial affordability challenges for households with lower incomes or higher borrowing costs.
Our Housing Affordability hub focuses on the broader relationship between housing costs and household finances. The Home Price-to-Income Ratio by State ranking specifically compares home prices with household income.
Likewise, the U.S. Housing Markets hub provides broader market context, including supply, demand, mortgage-rate effects, and market conditions that can influence both renters and buyers.
Why Statewide Rent-vs-Buy Numbers Can Mislead
State rankings are useful for broad comparisons, but they can hide enormous local differences.
A state’s expensive metro areas can have very different home-value and rent relationships from its smaller cities or rural areas. Housing type also matters. A renter comparing an apartment with a detached house is not evaluating the same product, even if both are located in the same city.
There is also an important source limitation in this table. Zillow directly provides state-level ZHVI home values. The June rent figures used here are secondary state-level benchmarks published by Keeping Up With Inflation from Zillow ZORI metro data. The publisher describes them as metro-weighted ZORI prints for each state, not a single statewide survey.
Use the state ranking to identify markets that deserve a closer look, then compare actual rents and homes in the city and neighborhood where you expect to live. The U.S. States hub can help you continue that state-level research.
Methodology and Sources
We calculated the 50-state price-to-rent ratios using one formula:
Typical home value ÷ annual rent benchmark
The numerator uses June 2026 Zillow Home Value Index values for all homes in the middle tier, using the smoothed and seasonally adjusted series. Zillow defines ZHVI as a measure of typical home value for a region, not a median sale price.
The denominator uses June 2026 state rent benchmarks published by Keeping Up With Inflation from Zillow ZORI metro data. The publisher describes those state figures as metro-weighted ZORI prints, not a single statewide survey. We multiplied each monthly rent benchmark by 12 to calculate annual rent.
Washington, D.C. is excluded because this article ranks states. Ratios are rounded to two decimal places after calculation.
The price-to-rent ratio is intentionally narrower than a full rent-versus-buy breakeven model. Financing, down payment, taxes, insurance, maintenance, transaction costs, appreciation, future rent growth, opportunity cost, and holding period are not inputs to the ratio.
Frequently Asked Questions
Is it cheaper to rent or buy in 2026?
If you are asking whether you should rent or buy in 2026, there is no single national answer for every household. The result depends on location, mortgage financing, down payment, taxes, insurance, maintenance, expected time in the home, and future housing costs. State price-to-rent ratios are useful for screening but cannot replace a household-specific calculation.
What is a good price-to-rent ratio?
There is no universal ratio that guarantees buying or renting is the better decision. A lower ratio means home values are lower relative to annual rent, while a higher ratio means home values are higher relative to annual rent. A complete comparison should also model financing and ownership costs.
Which states have the lowest price-to-rent ratios?
In this June 2026 comparison, Mississippi has the lowest ratio at about 11.28, followed by West Virginia at 12.82 and Louisiana at 14.06.
Which states have the highest price-to-rent ratios?
Washington ranks highest at about 28.45, followed by New York at 27.93 and California at 27.37.
Does a low price-to-rent ratio mean I should buy?
No. A low ratio means purchase prices are relatively low compared with rent in the data used. Your personal decision still depends on income, mortgage terms, taxes, insurance, maintenance, transaction costs, expected holding period, and other financial and lifestyle factors.
How do mortgage rates affect rent vs buy decisions?
Mortgage rates change the financing cost of buying. Higher rates raise principal-and-interest payments for the same loan amount, while lower rates reduce them. Because the price-to-rent ratio does not include mortgage financing, buyers should consider current loan terms separately.
Conclusion
The 2026 rent vs buy ranking shows a wide spread in price-to-rent ratios across the United States. Mississippi, West Virginia, and Louisiana sit at the low end, where home values are relatively low compared with rent. Washington, New York, and California sit at the high end, where home values carry a much larger premium over annual rent.
Those differences make price-to-rent ratios useful for comparing states, but they do not determine whether an individual household should rent or buy. The best decision comes from combining local housing prices with financing costs, ownership expenses, income, time horizon, and personal priorities.
For the next affordability check, compare state home values with household income in our Home Price-to-Income Ratio by State in 2026 ranking.