Property Tax Rates by State in 2026: All 50 States Ranked
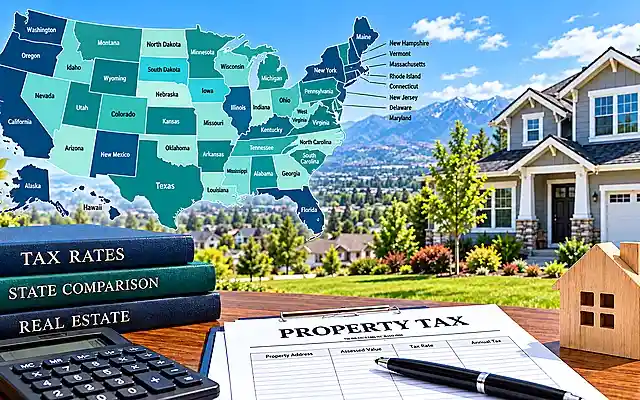
Property tax rates by state vary considerably across the United States. In the Tax Foundation’s comparison published in 2026, New Jersey and Illinois have the highest effective property-tax rates on owner-occupied housing at 1.88% each, while Hawaii has the lowest at 0.29%. The source ranks New Jersey first and Illinois second despite their identical percentages after rounding.
These rates describe property taxes paid on owner-occupied housing in 2024. They are drawn from a study published in 2026, not from statewide property-tax rates imposed for the 2026 tax year. Property-tax bills are primarily determined locally, so a state average is not a quote for an individual property.
What an Effective Property Tax Rate Measures
The figures below are not statutory statewide tax rates or local millage rates.
Property taxes are levied largely at the local level, and assessment systems vary among counties, cities, school districts and other taxing jurisdictions. The Tax Foundation reports an effective owner-occupied rate to help compare states with different local systems.
A 1.00% effective rate would correspond to $3,000 on a hypothetical home worth $300,000 if that percentage were applied directly. It is only an illustration: an actual owner’s tax bill can differ because of taxable value, assessment ratios, exemptions, school levies, special districts and assessment caps.
Property Tax Rates by State in 2026
The table compares property tax rates by state across all 50 states using the Tax Foundation’s 2024 measurements. Its 2023 comparison values are provided by the same 2026 Tax Foundation release, so both columns have consistent source attribution.
| Rank | State | 2024 effective rate | 2023 comparison rate (same source) | Tax on a $300,000 home* |
|---|---|---|---|---|
| 1 | New Jersey | 1.88% | 1.98% | $5,640 |
| 2 | Illinois | 1.88% | 1.91% | $5,640 |
| 3 | Connecticut | 1.54% | 1.62% | $4,620 |
| 4 | Vermont | 1.51% | 1.58% | $4,530 |
| 5 | New Hampshire | 1.50% | 1.62% | $4,500 |
| 6 | Nebraska | 1.44% | 1.48% | $4,320 |
| 7 | Texas | 1.40% | 1.47% | $4,200 |
| 8 | Ohio | 1.36% | 1.41% | $4,080 |
| 9 | Iowa | 1.33% | 1.36% | $3,990 |
| 10 | Wisconsin | 1.32% | 1.39% | $3,960 |
| 11 | New York | 1.30% | 1.31% | $3,900 |
| 12 | Pennsylvania | 1.26% | 1.31% | $3,780 |
| 13 | Kansas | 1.21% | 1.22% | $3,630 |
| 14 | Michigan | 1.19% | 1.23% | $3,570 |
| 15 | Rhode Island | 1.12% | 1.19% | $3,360 |
| 16 | Massachusetts | 1.00% | 1.03% | $3,000 |
| 17 | Minnesota | 1.00% | 1.01% | $3,000 |
| 18 | South Dakota | 1.00% | 1.03% | $3,000 |
| 19 | Maine | 0.98% | 1.04% | $2,940 |
| 20 | Alaska | 0.94% | 0.95% | $2,820 |
| 21 | Maryland | 0.92% | 0.95% | $2,760 |
| 22 | North Dakota | 0.92% | 0.92% | $2,760 |
| 23 | Missouri | 0.89% | 0.91% | $2,670 |
| 24 | Oregon | 0.81% | 0.83% | $2,430 |
| 25 | Georgia | 0.79% | 0.82% | $2,370 |
| 26 | Oklahoma | 0.79% | 0.80% | $2,370 |
| 27 | Florida | 0.78% | 0.80% | $2,340 |
| 28 | Virginia | 0.78% | 0.79% | $2,340 |
| 29 | Indiana | 0.76% | 0.77% | $2,280 |
| 30 | Washington | 0.75% | 0.77% | $2,250 |
| 31 | Kentucky | 0.74% | 0.76% | $2,220 |
| 32 | California | 0.70% | 0.70% | $2,100 |
| 33 | North Carolina | 0.66% | 0.69% | $1,980 |
| 34 | New Mexico | 0.63% | 0.62% | $1,890 |
| 35 | Montana | 0.61% | 0.64% | $1,830 |
| 36 | Mississippi | 0.58% | 0.60% | $1,740 |
| 37 | Arkansas | 0.56% | 0.57% | $1,680 |
| 38 | Louisiana | 0.55% | 0.54% | $1,650 |
| 39 | Delaware | 0.54% | 0.55% | $1,620 |
| 40 | Wyoming | 0.53% | 0.52% | $1,590 |
| 41 | Tennessee | 0.52% | 0.56% | $1,560 |
| 42 | West Virginia | 0.51% | 0.51% | $1,530 |
| 43 | Nevada | 0.50% | 0.51% | $1,500 |
| 44 | Colorado | 0.50% | 0.50% | $1,500 |
| 45 | Idaho | 0.50% | 0.53% | $1,500 |
| 46 | South Carolina | 0.49% | 0.51% | $1,470 |
| 47 | Arizona | 0.48% | 0.51% | $1,440 |
| 48 | Utah | 0.48% | 0.50% | $1,440 |
| 49 | Alabama | 0.37% | 0.37% | $1,110 |
| 50 | Hawaii | 0.29% | 0.30% | $870 |
The $300,000 column is $300,000 multiplied by the displayed 2024 effective rate. It is a comparison illustration, not a prediction of property taxes on any particular home.
Source: Tax Foundation, Property Taxes by State and County, 2026, Table 2, 2024 effective property taxes on owner-occupied housing; U.S. Census Bureau American Community Survey and Tax Foundation calculations. Rates are displayed to two decimal places, so some adjacent ranks have equal rounded values. Washington, D.C., is excluded from the 50-state numbering.
The Highest Property Tax States
The states with the highest effective rates are concentrated in the Northeast and Midwest, although Texas also appears in the top ten.
New Jersey ranks first at 1.88%, and Illinois ranks second at 1.88%. Both correspond to $5,640 a year when the displayed statewide percentage is applied to the same illustrative $300,000 home. Connecticut follows at 1.54%, Vermont at 1.51% and New Hampshire at 1.50%.
The ten highest-rate states, retaining the source’s rank order, are:
- New Jersey: 1.88%
- Illinois: 1.88%
- Connecticut: 1.54%
- Vermont: 1.51%
- New Hampshire: 1.50%
- Nebraska: 1.44%
- Texas: 1.40%
- Ohio: 1.36%
- Iowa: 1.33%
- Wisconsin: 1.32%
Several high-rate states depend heavily on property taxes to finance local services. As the Tax Foundation explains, these taxes help fund schools, roads, police, fire protection and other local government functions. A statewide average still cannot determine the bill for a particular city, county or school district.
Before buying in one of these areas, read our high property tax states guide to check the seller’s bill, assessment rules, exemptions and how a buyer-specific tax estimate could affect mortgage escrow.
The Lowest Property Tax States
Hawaii has the lowest effective rate in the 2024 state comparison at 0.29%. Alabama follows at 0.37%. Utah and Arizona each display 0.48%; South Carolina displays 0.49%.
The ten lowest-rate states, from lowest to higher, are:
- Hawaii: 0.29%
- Alabama: 0.37%
- Utah: 0.48%
- Arizona: 0.48%
- South Carolina: 0.49%
- Idaho: 0.50%
- Colorado: 0.50%
- Nevada: 0.50%
- West Virginia: 0.51%
- Tennessee: 0.52%
A lower statewide percentage does not necessarily mean a lower annual bill. A household in a low-rate state can face a substantial tax payment if its property is expensive or its local taxing districts differ from the statewide pattern. Comparing property tax rates by state is therefore a starting point, not a substitute for checking local tax records.
If you are narrowing down where to buy, our low property tax states guide explains how to check property-specific taxes, exemptions, insurance and overall ownership costs.
For additional home-value context, see our Average Home Price by State analysis.
Rate and Tax Bill Are Not the Same Thing
Suppose two hypothetical homes each had a value of $300,000. At the 2024 statewide effective rate of 1.88%, the illustration for New Jersey or Illinois is $5,640 annually. At Hawaii’s 0.29%, it is $870 annually. The illustrated difference is $4,770 a year on the same assumed value.
Real housing markets do not hold values constant. Home prices, taxable assessments and exemptions vary; higher property values in a low-rate state can offset part of the percentage advantage. When evaluating property tax rates by state, homebuyers should compare local assessments, exemptions and the values of homes they can actually afford. Property taxes are one element of owner affordability alongside mortgage costs, insurance, maintenance, utilities and other expenses.
Our Housing Affordability hub covers broader homeownership pressures, and U.S. States provides additional state-level comparisons.
How to Read the 2024 and 2023 Figures
The Tax Foundation’s 2026 release presents both a 2024 effective-rate column and a 2023 comparison column. Those two columns belong to the same publication and are the appropriate pair to consult when examining the reported data across these years.
Older source releases may report different historical figures because of data revisions or methodology. Do not combine values from different releases to infer an annual increase or decrease; use the pair of columns from the same publication for a consistent comparison.
An effective rate is a ratio of taxes paid to owner-occupied home value. Changes in either numerator or denominator can move that ratio; a change in the statewide effective rate does not mean every homeowner’s individual tax bill changed by the same proportion.
Why Property Taxes Differ Within the Same State
State rankings are useful for broad comparisons, but actual property taxes are local. An individual bill may depend on:
- County and municipal taxing rates.
- School district levies and special taxing districts.
- Assessment ratios and the distinction between market, assessed and taxable value.
- Homestead and other qualifying exemptions.
- Senior, veteran or disability-related programs where applicable.
- Assessment growth limits and rules following a property transfer.
Two similar properties in the same state can therefore have materially different tax bills. Buyers should review the parcel’s official tax history, assessment status, relevant local exemptions and potential transfer-related changes instead of multiplying an asking price by a statewide percentage.
Property Taxes and Overall Cost of Living
A state can have relatively low effective property taxes yet high home prices, expensive insurance or above-average utilities. Conversely, a state with higher property-tax rates may have lower purchase prices or a different mix of other household costs. Property tax rates by state are one component of housing affordability, not a complete ranking of where it costs least to own a home.
This ranking should be one input in a location decision. Our Cost of Living research provides broader comparisons, while Rent vs. Buy by State examines how housing prices relate to rents.
How This Ranking Differs From Home Insurance vs. Property Taxes
This article answers one question: how do statewide effective property-tax rates on owner-occupied housing compare across all 50 states?
Our separate Home Insurance vs. Property Taxes by State article compares two distinct recurring homeowner expenses. A state can rank high for property taxes and differently for insurance. That combined-cost comparison is a separate reader task.
Methodology
This article uses Table 2 of the Tax Foundation’s Property Taxes by State and County, 2026, published in March 2026. The ranking is based on 2024 property taxes paid as a percentage of owner-occupied housing value, calculated from U.S. Census Bureau American Community Survey datasets and Tax Foundation methodology.
The primary column is 2024; the adjacent 2023 comparison column is from that same 2026 release. The source’s ranks are retained when the displayed percentages are tied after rounding. Washington, D.C., is excluded because the article ranks only the 50 states.
The Tax Foundation also publishes a separate 2024 county table. County rates are not substituted into this statewide ranking. The state comparison excludes business and non-owner-occupied housing taxes as explained in the source’s Table 2 note.
The $300,000-home figures are recalculated from the displayed 2024 rates as $300,000 × (rate ÷ 100). Those amounts are illustrative, not forecasts of what a new buyer or current owner will pay. Local assessment, exemption and tax-rate information is necessary for a property-level estimate.
Questions About Property Tax Rates by State
Which state has the highest property tax rate?
New Jersey ranks first and Illinois second in the Tax Foundation’s 2024 owner-occupied effective-rate comparison. Both display 1.88% after rounding. The ordering follows the source’s ranks and does not imply a meaningful difference between identical displayed percentages.
Which state has the lowest property tax rate?
Hawaii has the lowest 2024 effective property-tax rate at 0.29%, followed by Alabama at 0.37% in this statewide owner-occupied comparison.
Is a statewide effective rate the tax rate I will pay on my home?
No. It is an aggregate ratio used to compare states, not the local statutory rate or a buyer’s property-specific tax estimate. Your bill can depend on taxable value, assessment rules, exemptions and overlapping local levies.
Why can a state with a low property-tax rate still have a high tax bill?
Property value matters. A small percentage of a very expensive home can represent a substantial dollar amount, even before local assessments and exemptions are considered.
Are these tax rates for the 2026 tax year?
No. 2026 is the publication year of the Tax Foundation comparison; the statewide effective-rate measurements are for 2024. They are not an official schedule of local taxes enacted for 2026.
Property Tax Rates Are One Piece of Homeowner Affordability
Hawaii’s 0.29% and New Jersey’s and Illinois’ 1.88% illustrate how far apart statewide effective rates can be. But the percentage does not determine which home or location will be more affordable for an individual household.
Home values, local tax rules, exemptions, insurance, financing costs and other recurring expenses all matter. Understanding property tax rates by state provides a useful starting point, but the final decision should be based on costs that apply to specific homes.
For a comparison of two major homeowner expenses, see Home Insurance vs. Property Taxes by State.