Property Tax Rates by State in 2026: All 50 States Ranked
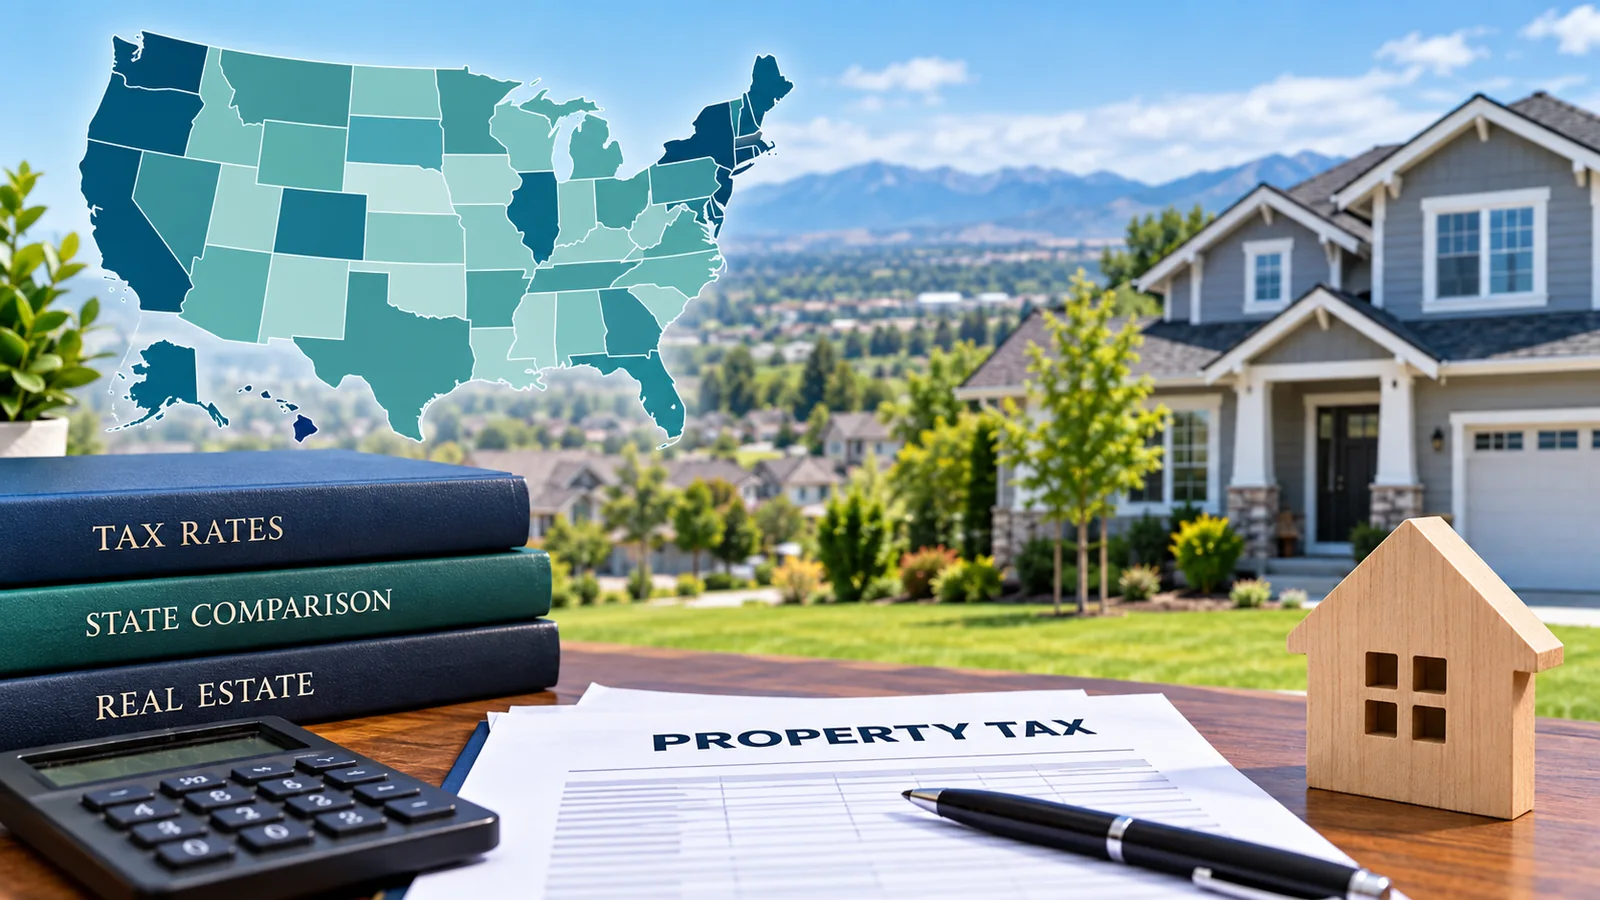
Property tax rates by state vary widely, even though property taxes are usually set by local governments rather than by a single statewide rate. In the latest Tax Foundation state comparison published in 2026, Illinois has the highest effective property tax rate at 1.83%, while Hawaii has the lowest at 0.32%.
For a fair state-to-state comparison, this article uses the Tax Foundation’s effective property tax rate on owner-occupied housing. That measure divides total real estate taxes paid by total home value.
The Tax Foundation’s 2026 page uses 2023 data for its state table. So “2026” here refers to the latest nationwide state comparison published in 2026, not to property taxes assessed during calendar year 2026.
What an Effective Property Tax Rate Measures
The figures below are not statutory statewide tax rates or local millage rates.
Property taxes are levied almost exclusively at the local level, and assessment systems vary across counties, cities, school districts, and other taxing jurisdictions. The Tax Foundation uses an effective rate because ordinary local millages are not directly comparable across states.
An effective rate of 1.00%, for example, corresponds to about $3,000 a year on a $300,000 home if the statewide rate were applied directly.
That is only an illustration. An actual homeowner’s bill can differ because of assessed value, exemptions, school levies, special districts, assessment caps, and other local rules.
Property Tax Rates by State in 2026
| Rank | State | 2023 Effective Rate | 2022 Effective Rate | Tax on a $300,000 Home* |
|---|---|---|---|---|
| 1 | Illinois | 1.83% | 1.75% | $5,490 |
| 2 | New Jersey | 1.77% | 1.73% | $5,310 |
| 3 | Connecticut | 1.48% | 1.43% | $4,440 |
| 4 | Nebraska | 1.43% | 1.32% | $4,290 |
| 5 | Vermont | 1.42% | 1.33% | $4,260 |
| 6 | New Hampshire | 1.41% | 1.37% | $4,230 |
| 7 | Texas | 1.36% | 1.26% | $4,080 |
| 8 | Ohio | 1.31% | 1.23% | $3,930 |
| 9 | New York | 1.26% | 1.23% | $3,780 |
| 10 | Wisconsin | 1.25% | 1.21% | $3,750 |
| 11 | Iowa | 1.23% | 1.15% | $3,690 |
| 12 | Kansas | 1.19% | 1.08% | $3,570 |
| 13 | Pennsylvania | 1.19% | 1.14% | $3,570 |
| 14 | Michigan | 1.15% | 1.08% | $3,450 |
| 15 | Rhode Island | 1.05% | 1.03% | $3,150 |
| 16 | Minnesota | 0.99% | 0.92% | $2,970 |
| 17 | South Dakota | 0.99% | 0.85% | $2,970 |
| 18 | Massachusetts | 0.97% | 0.91% | $2,910 |
| 19 | North Dakota | 0.94% | 0.86% | $2,820 |
| 20 | Maine | 0.94% | 0.85% | $2,820 |
| 21 | Alaska | 0.91% | 0.86% | $2,730 |
| 22 | Maryland | 0.90% | 0.85% | $2,700 |
| 23 | Missouri | 0.88% | 0.79% | $2,640 |
| 24 | Oregon | 0.78% | 0.73% | $2,340 |
| 25 | Oklahoma | 0.77% | 0.72% | $2,310 |
| 26 | Georgia | 0.77% | 0.69% | $2,310 |
| 27 | Indiana | 0.77% | 0.68% | $2,310 |
| 28 | Virginia | 0.77% | 0.71% | $2,310 |
| 29 | Washington | 0.75% | 0.69% | $2,250 |
| 30 | Florida | 0.74% | 0.64% | $2,220 |
| 31 | Kentucky | 0.73% | 0.67% | $2,190 |
| 32 | California | 0.70% | 0.65% | $2,100 |
| 33 | North Carolina | 0.62% | 0.57% | $1,860 |
| 34 | New Mexico | 0.61% | 0.59% | $1,830 |
| 35 | Montana | 0.60% | 0.53% | $1,800 |
| 36 | Mississippi | 0.58% | 0.53% | $1,740 |
| 37 | Louisiana | 0.55% | 0.50% | $1,650 |
| 38 | Wyoming | 0.55% | 0.47% | $1,650 |
| 39 | Arkansas | 0.53% | 0.49% | $1,590 |
| 40 | Delaware | 0.50% | 0.46% | $1,500 |
| 41 | Colorado | 0.50% | 0.45% | $1,500 |
| 42 | Nevada | 0.49% | 0.45% | $1,470 |
| 43 | Tennessee | 0.49% | 0.45% | $1,470 |
| 44 | Idaho | 0.48% | 0.44% | $1,440 |
| 45 | West Virginia | 0.48% | 0.46% | $1,440 |
| 46 | Utah | 0.47% | 0.42% | $1,410 |
| 47 | South Carolina | 0.47% | 0.43% | $1,410 |
| 48 | Arizona | 0.44% | 0.42% | $1,320 |
| 49 | Alabama | 0.36% | 0.31% | $1,080 |
| 50 | Hawaii | 0.32% | 0.26% | $960 |
Source: Tax Foundation, Property Taxes by State and County, 2026, using U.S. Census Bureau 2023 American Community Survey data and Tax Foundation calculations. D.C. is excluded from this 50-state ranking.
The $300,000-home column is a simple illustration calculated as home value × statewide effective rate. It is not an estimate of the actual bill for a specific property.
The Highest Property Tax States
The highest effective property tax rates are concentrated in parts of the Midwest and Northeast.
Illinois ranks first at 1.83%. On a hypothetical $300,000 home, that corresponds to about $5,490 a year before accounting for local exemptions, assessment rules, or differences between assessed and market value.
New Jersey ranks second at 1.77%, followed by Connecticut at 1.48%, Nebraska at 1.43%, and Vermont at 1.42%.
The 10 highest-rate states are:
- Illinois – 1.83%
- New Jersey – 1.77%
- Connecticut – 1.48%
- Nebraska – 1.43%
- Vermont – 1.42%
- New Hampshire – 1.41%
- Texas – 1.36%
- Ohio – 1.31%
- New York – 1.26%
- Wisconsin – 1.25%
Several high-rate states rely heavily on property taxes to finance local services. The Tax Foundation notes that property taxes are a major funding source for schools, roads, police, fire protection, emergency services, and other local government functions.
That local structure is also why a statewide ranking should not be treated as the rate for a particular county or city.
The Lowest Property Tax States
Hawaii has the lowest effective property tax rate in the Tax Foundation state table at 0.32%.
Alabama follows at 0.36%. Arizona is at 0.44%, while South Carolina and Utah are tied at 0.47%.
The 10 lowest-rate states are:
- Hawaii – 0.32%
- Alabama – 0.36%
- Arizona – 0.44%
- South Carolina – 0.47%
- Utah – 0.47%
- Idaho – 0.48%
- West Virginia – 0.48%
- Nevada – 0.49%
- Tennessee – 0.49%
- Colorado – 0.50%
A low rate does not necessarily mean a low annual bill.
A homeowner in a low-rate state can still face a substantial dollar payment if the property value is high. That is why it helps to compare this ranking with our Average Home Price by State analysis rather than treating the percentage alone as a complete affordability measure.
Rate and Tax Bill Are Not the Same Thing
If two homes were both worth $300,000, Illinois’ 1.83% effective rate would correspond to about $5,490 a year, while Hawaii’s 0.32% rate would correspond to about $960.
That is a difference of roughly $4,530 on the same hypothetical home value.
Real housing markets do not hold values constant, however. A lower-rate state may have much more expensive homes, which can narrow the gap in the actual dollar bill.
Property taxes are therefore only one component of homeowner affordability. Purchase price, mortgage rates, insurance, maintenance, utilities, and other recurring costs also matter.
Our Housing Affordability hub looks at those broader ownership pressures, while the U.S. States hub provides additional state-level housing and economic comparisons.
Effective Rates Rose in Every State From 2022 to 2023
The current Tax Foundation state table also provides the comparable 2022 effective rate. All 50 states show a higher effective rate in 2023 than in 2022.
Some of the larger increases include:
- South Dakota: 0.85% to 0.99%
- Nebraska: 1.32% to 1.43%
- Kansas: 1.08% to 1.19%
- Texas: 1.26% to 1.36%
- Florida: 0.64% to 0.74%
A higher effective rate does not necessarily mean every homeowner’s actual tax bill increased by the same percentage. The statewide rate is a ratio of taxes paid to home value, so changes in both tax collections and property values can affect it.
Why Property Taxes Differ Within the Same State
State rankings are useful for broad comparisons, but actual property taxes are local.
A homeowner’s bill may be affected by:
- county and municipal tax rates;
- school district levies;
- assessment ratios;
- homestead exemptions;
- senior, veteran, or disability exemptions;
- caps on annual assessment increases;
- special taxing districts;
- differences between market value and assessed value.
Two similar homes in the same state can therefore have meaningfully different tax bills.
For a specific home purchase, the better approach is to check the property’s recent tax history, assessed value, exemptions, and all taxing jurisdictions rather than simply multiplying the purchase price by the statewide percentage.
Property Taxes and Overall Cost of Living
Property taxes are only one part of the cost of owning a home.
A state can have a low effective property tax rate but high home prices, insurance premiums, utilities, or other taxes. A state with a high property tax rate may have lower purchase prices or a different mix of state and local taxes.
That is why this ranking should be used as one piece of a broader location comparison.
Our Cost of Living research looks beyond housing taxes, and our Rent vs. Buy by State analysis examines how ownership costs compare with renting across the country.
Property tax rates can materially affect homeownership costs, but they should not be used by themselves to label a state affordable or unaffordable.
How This Ranking Differs From Home Insurance vs. Property Taxes
This article answers a focused question: how do effective residential property tax rates compare across all 50 states?
Our Home Insurance vs. Property Taxes by State analysis answers a different question by comparing two recurring homeowner expenses.
Keeping the topics separate avoids hiding meaningful differences. A state can rank high for property taxes but have more moderate insurance costs, or the reverse.
If you want to compare those two expenses directly, the insurance-versus-property-tax analysis is the better next step.
Methodology
This ranking uses Table 2 of the Tax Foundation’s Property Taxes by State and County, 2026.
The primary metric is the 2023 effective property tax rate on owner-occupied housing. The Tax Foundation defines that measure as total real estate taxes paid divided by total home value.
The underlying source is the U.S. Census Bureau’s 2023 American Community Survey, with Tax Foundation calculations.
The table also provides comparable 2022 effective rates.
District of Columbia is excluded because this article ranks the 50 states. The Tax Foundation notes that D.C.’s position does not affect the states’ ranks.
The Tax Foundation page also includes a county table using 2024 data. We do not mix those county figures into this state ranking because the current state table uses 2023 data.
The hypothetical $300,000-home amounts are calculated by multiplying $300,000 by each state’s statewide effective rate. They are illustrations only and should not be interpreted as actual property-tax bills.
Questions About Property Tax Rates by State
Which state has the highest property tax rate?
Illinois has the highest effective property tax rate in the current Tax Foundation state table at 1.83%, followed by New Jersey at 1.77%.
Which state has the lowest property tax rate?
Hawaii has the lowest effective property tax rate at 0.32%, followed by Alabama at 0.36%.
Is the state property tax rate the rate I will pay on my home?
No. These are statewide effective rates used for comparison. Actual property taxes are primarily local and depend on assessed value, exemptions, millages, school districts, and other taxing jurisdictions.
Why can a state with a low property tax rate still have a high tax bill?
Because the bill also depends on the value of the property. A low percentage applied to an expensive home can still produce a large annual payment.
Are these 2026 tax rates?
This is a 2026 comparison because it uses the latest Tax Foundation state property-tax page published in 2026. The current state table itself uses 2023 ACS data.
Property Tax Rates Are One Piece of Homeowner Affordability
The gap between Hawaii’s 0.32% effective rate and Illinois’ 1.83% rate is substantial, but the percentage alone does not determine which state will be cheaper for a particular homeowner.
Home value, local tax rules, insurance, financing costs, and other recurring expenses all matter.
Use this ranking to understand the statewide property-tax landscape, then compare it with the actual housing costs that apply to the location and property you are considering.
For the next step, see our Home Insurance vs. Property Taxes by State analysis to compare two major recurring homeowner costs.