
U.S. States
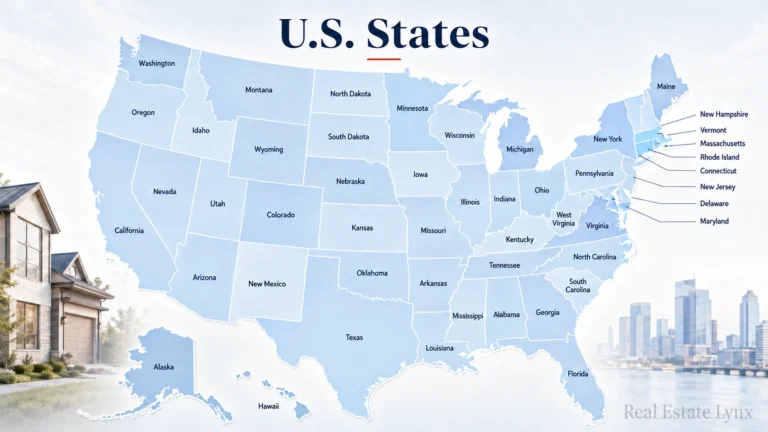
Explore all 50 U.S. states through housing markets, affordability, cost of living, migration, taxes, insurance, economic conditions, housing risk, and other factors that shape where and how people live across the United States.
Real Estate Lynx uses this hub to organize state-level research and help readers compare housing conditions, living costs, population trends, economic differences, risks, and location characteristics before moving into more detailed city, metro, or neighborhood research.
Explore Housing and Living Conditions by State
Housing conditions and living costs vary significantly from one state to another.
Some states have high home prices but strong household incomes. Others offer lower housing costs but may have higher insurance expenses, property taxes, transportation costs, or other trade-offs.
Population growth, job opportunities, housing construction, climate, geography, migration, and local regulations can also affect how attractive or affordable a state may be for different households.
State-level research provides a useful starting point for understanding these broader differences before examining individual cities, metro areas, neighborhoods, or properties.
What We Analyze at the State Level
Real Estate Lynx state research may examine several factors that influence housing, affordability, and relocation decisions.
Housing Markets
State housing-market research may include:
- Home prices
- Price trends
- Housing inventory
- New listings
- Sales activity
- Days on market
- New construction
- Housing supply
- Housing demand
- Mortgage-rate effects
- Regional market differences
Compare current state-level home values in our Average Home Price by State in 2026: All 50 States Ranked analysis.
Statewide statistics provide broad context, although individual metro areas and cities within the same state can behave very differently.
Explore U.S. Housing Markets for broader housing-market trends and analysis.
Housing Affordability
Housing affordability depends on more than home prices.
Relevant factors may include:
- Household income
- Home prices
- Rent levels
- Mortgage rates
- Property taxes
- Insurance costs
- Down-payment requirements
- Utilities
- Transportation expenses
A state with relatively low home prices may still be difficult for local households to afford if incomes are also low or other housing-related expenses are high.
Our Home Price-to-Income Ratio by State in 2026 analysis compares housing values with median household income across all 50 states.
Renters can also compare current one-bedroom rental costs in our Average Rent by State in 2026: All 50 States Ranked analysis.
Explore Housing Affordability for deeper analysis of housing costs and purchasing power.
Cost of Living
The cost of living can vary considerably across states.
Important expenses may include:
- Housing
- Food
- Transportation
- Utilities
- Healthcare
- Taxes
- Insurance
- Childcare
- Everyday goods and services
State averages are useful for broad comparisons, but living costs can differ substantially between urban, suburban, and rural areas within the same state.
Our Cheapest States to Live in 2026 ranking compares all 50 states using federal Regional Price Parity data.
Explore Cost of Living for broader household-expense research.
Population and Migration
Population growth and migration can affect housing demand, employment, infrastructure, and local development.
State-level migration research may examine:
- Domestic migration
- International migration
- Population growth
- Population decline
- Household formation
- Retirement migration
- Employment-related moves
- Affordability-driven relocation
Some states consistently attract new residents, while others experience net domestic outmigration or slower population growth.
Our analysis of Where Americans Are Moving in 2026 examines the latest state-to-state domestic migration patterns.
Explore U.S. Migration Trends for broader research on where Americans are moving.
Employment and the Economy
Housing markets are closely connected with state and regional economies.
Relevant factors may include:
- Employment growth
- Unemployment
- Major industries
- Wage levels
- Business activity
- Population growth
- Construction activity
- Interest-rate sensitivity
- Household income
States with strong employment growth may experience additional housing demand, especially when housing supply cannot expand quickly enough.
Explore Housing Economy for analysis of the economic forces shaping U.S. housing.
Taxes
Taxes can affect both housing affordability and the overall cost of living.
Depending on the state, important taxes and charges may include:
- Property taxes
- State income taxes
- Sales taxes
- Real estate transfer taxes
- Local taxes
- Vehicle taxes or fees
Tax structures differ considerably across the United States.
A state with no individual income tax may rely more heavily on other forms of taxation, so comparisons should consider the broader tax picture rather than a single rate.
Insurance Costs
Insurance has become an increasingly important part of housing affordability in some states.
Homeowners may face different insurance conditions because of:
- Hurricanes
- Flooding
- Wildfires
- Severe storms
- Hail
- Tornadoes
- Coastal exposure
- Construction costs
- Claims experience
- Insurer availability
High or rapidly rising insurance premiums can materially affect the monthly cost of owning a home.
Our Home Insurance vs Property Taxes by State in 2026 analysis compares two major recurring ownership expenses across states.
Explore Housing Risk & Resilience for broader research on housing-related hazards, insurance, and resilience.
Explore the 50 U.S. States
Real Estate Lynx state coverage is organized across all 50 states.
As state-specific pages and research are published, this hub will serve as the central directory for accessing them.
Northeast
- Connecticut
- Maine
- Massachusetts
- New Hampshire
- Rhode Island
- Vermont
- New Jersey
- New York
- Pennsylvania
Midwest
- Illinois
- Indiana
- Michigan
- Ohio
- Wisconsin
- Iowa
- Kansas
- Minnesota
- Missouri
- Nebraska
- North Dakota
- South Dakota
South
- Delaware
- Florida
- Georgia
- Maryland
- North Carolina
- South Carolina
- Virginia
- West Virginia
- Alabama
- Kentucky
- Mississippi
- Tennessee
- Arkansas
- Louisiana
- Oklahoma
- Texas
West
- Arizona
- Colorado
- Idaho
- Montana
- Nevada
- New Mexico
- Utah
- Wyoming
- Alaska
- California
- Hawaii
- Oregon
- Washington
Regional classifications are useful for organization, but housing, economic, climate, and affordability conditions can vary substantially within each region.
Comparing U.S. States
State comparisons can help readers identify broad differences in housing costs, affordability, taxes, migration, economic conditions, and quality-of-life factors.
Useful comparison factors may include:
- Median or typical home prices
- Typical rents
- Household incomes
- Housing affordability
- Cost of living
- Property taxes
- State income taxes
- Insurance costs
- Population growth
- Migration trends
- Employment
- Housing construction
- Climate exposure
- Transportation
- Quality-of-life considerations
No single state is best for every person.
Different households may prioritize affordability, employment, climate, taxes, schools, family proximity, transportation, recreation, or other factors differently.
Our Texas vs. Florida Cost of Living 2026 analysis provides one example of comparing two states across housing, income, taxes, insurance, and other recurring costs.
Explore Compare Places for broader side-by-side location research.
States With Lower Housing and Living Costs
Lower housing or living costs can make some states attractive to households seeking greater affordability.
However, low prices should not be considered in isolation.
A lower-cost state may also have:
- Lower average wages
- Higher property taxes
- Higher transportation costs
- Limited employment opportunities in certain industries
- Higher insurance costs
- Fewer housing options in high-demand locations
Affordability should therefore be evaluated relative to income and the full cost of maintaining a household.
The Cheapest States to Live in 2026 provides a state-level comparison focused specifically on overall consumer price levels.
States With Higher Housing Costs
States with high home prices may have strong employment markets, higher wages, limited housing supply, strong population demand, valuable amenities, or geographic constraints on development.
High statewide prices can also be driven by a relatively small number of expensive metropolitan areas.
For that reason, state averages should be supplemented with metro- and city-level research when evaluating a specific place.
Explore U.S. Cities & Metro Areas for more localized housing and location research.
State Housing Supply
The ability to add new housing varies substantially across states.
Housing construction may be influenced by:
- Population growth
- Available land
- Local zoning
- Building regulations
- Construction costs
- Labor availability
- Infrastructure
- Environmental restrictions
- Financing
- Local approval processes
States with rapidly growing populations and limited housing construction may experience stronger price and rent pressure.
States and metros that add housing more readily may be better positioned to absorb population growth without the same degree of affordability pressure.
Urban, Suburban, and Rural Differences
Statewide averages can hide major differences between locations.
A single state may contain:
- Expensive urban centers
- More affordable suburbs
- Rapidly growing exurban communities
- Smaller cities
- Rural areas with very different housing markets
Housing conditions in a state’s largest metropolitan area may bear little resemblance to those in rural counties several hours away.
Readers making relocation or housing decisions should therefore move from state-level research into city, metro, neighborhood, and eventually property-level analysis.
State Migration Patterns
Migration can reveal how people respond to housing costs, employment opportunities, retirement preferences, climate, taxes, family circumstances, and lifestyle considerations.
States experiencing strong population inflows may see additional demand for:
- Homes for sale
- Rental housing
- New construction
- Infrastructure
- Schools
- Transportation
- Local services
However, migration alone does not determine housing-market performance.
Supply, construction, employment, incomes, mortgage rates, demographics, and local market conditions also matter.
State Population Growth
Population growth can support housing demand, but the relationship is not always simple.
Population may grow because of:
- Domestic migration
- International immigration
- Births
- Employment growth
- Retirement migration
- University populations
- Military installations
- Other demographic factors
The number and type of households formed can be just as important to housing demand as total population growth.
State Economic Differences
The U.S. economy is not evenly distributed across states.
Different states may rely more heavily on industries such as:
- Technology
- Finance
- Healthcare
- Manufacturing
- Energy
- Agriculture
- Tourism
- Government
- Logistics
- Education
- Professional services
Industry composition can affect employment stability, wages, migration, and housing demand.
Economic diversification may also influence how resilient a state’s housing markets are during downturns.
Climate and Housing Risk by State
Location risk can materially affect the long-term cost and practicality of owning housing.
Depending on the state, relevant risks may include:
- Hurricanes
- Flooding
- Wildfires
- Tornadoes
- Extreme heat
- Drought
- Severe winter weather
- Coastal erosion
- Water availability
These risks may affect:
- Insurance premiums
- Insurance availability
- Property maintenance
- Building standards
- Infrastructure
- Utility costs
- Property values
- Long-term housing demand
State-level risk analysis provides broad context, but individual properties can have very different exposure even within the same community.
Explore Housing Risk & Resilience for more detailed risk research.
Choosing a State to Live In
Selecting a state involves balancing financial, practical, and personal factors.
Can You Afford the Housing?
Compare home prices or rents with expected household income, mortgage costs, taxes, insurance, and other recurring expenses.
What Is the Overall Cost of Living?
Housing may be the largest expense, but transportation, food, taxes, utilities, insurance, healthcare, and childcare can also materially affect household finances.
What Are the Employment Opportunities?
Consider whether the state’s major industries align with your occupation, income expectations, and career goals.
How Do Taxes Affect Your Household?
Review the broader state and local tax structure rather than focusing on one tax category.
What Are the Insurance and Housing Risks?
Housing costs may be significantly affected by insurance premiums, availability of coverage, and property-specific hazard exposure.
Is the Population Growing?
Growth may indicate economic opportunity and housing demand, although it can also place pressure on housing and infrastructure.
What Types of Communities Are Available?
States often offer very different urban, suburban, small-city, and rural lifestyles.
Does the State Fit Your Priorities?
Climate, family proximity, transportation, recreation, schools, healthcare, culture, and other personal considerations may influence a relocation decision.
No national ranking can determine the right answer for every household.
Best States to Live In
State rankings can be useful discovery tools when their methodology is transparent.
Our Best States to Live in 2026 analysis compares all 50 states using six federal indicators covering cost of living, household income, unemployment, educational attainment, homicide mortality, and overall mortality.
A state that performs well under one methodology may not perform equally well for a household that places greater weight on housing affordability, climate, employment, taxes, family proximity, or another factor.
Explore Best Places to Live for broader rankings and location research.
Moving to Another State
Interstate relocation can involve more than choosing a destination.
Readers may need to consider:
- Housing availability
- Employment
- Cost of living
- Taxes
- Insurance
- Vehicle registration
- Schools
- Healthcare
- Moving costs
- Commuting
- Climate
- Local regulations
Our guide to Moving From California to Texas in 2026 provides a practical example of evaluating housing, taxes, income, moving requirements, and other interstate relocation considerations.
Explore Relocation for broader research related to evaluating and planning moves within the United States.
State Data Limitations
State-level data is useful for comparing broad conditions, but it has limitations.
State averages may combine locations with very different:
- Housing prices
- Incomes
- Job markets
- Population densities
- Taxes
- Insurance conditions
- Transportation systems
- Climate risks
Different datasets may also use different reporting periods, geographic definitions, methodologies, and revision schedules.
Readers should therefore treat state-level statistics as a starting point rather than a complete description of local conditions.
For more information about how Real Estate Lynx evaluates sources and data, review our Editorial Policy.
Featured U.S. States Research
Start with these published Real Estate Lynx analyses:
- Best States to Live in 2026
- Cheapest States to Live in 2026
- Home Price-to-Income Ratio by State 2026
- Where Americans Are Moving in 2026
- Home Insurance vs Property Taxes by State 2026
- Texas vs. Florida Cost of Living 2026
- Moving From California to Texas 2026
Research U.S. States
Real Estate Lynx will continue expanding state-level housing and location research across the country.
Coverage may include:
- State housing markets
- State home-price trends
- State affordability
- State cost of living
- State migration
- State population trends
- State taxes
- State insurance conditions
- Best places within states
- State relocation guides
- State economic conditions
- State housing risk
- State-to-state comparisons
As new state pages and research become available, this hub will serve as a central starting point for exploring housing, costs, migration, risk, and living conditions across all 50 U.S. states.
Explore Related Real Estate Lynx Research
Continue exploring:
- U.S. Housing Markets
- U.S. Cities & Metro Areas
- Neighborhoods
- Cost of Living
- Compare Places
- Best Places to Live
- Relocation
- U.S. Migration Trends
- Housing Affordability
- Housing Risk & Resilience
- Housing Economy
Together, these hubs help readers move from broad state-level research into more specific housing-market, affordability, cost, migration, risk, place, and relocation analysis across the United States.