Where Americans Are Moving in 2026: State-to-State Migration Trends
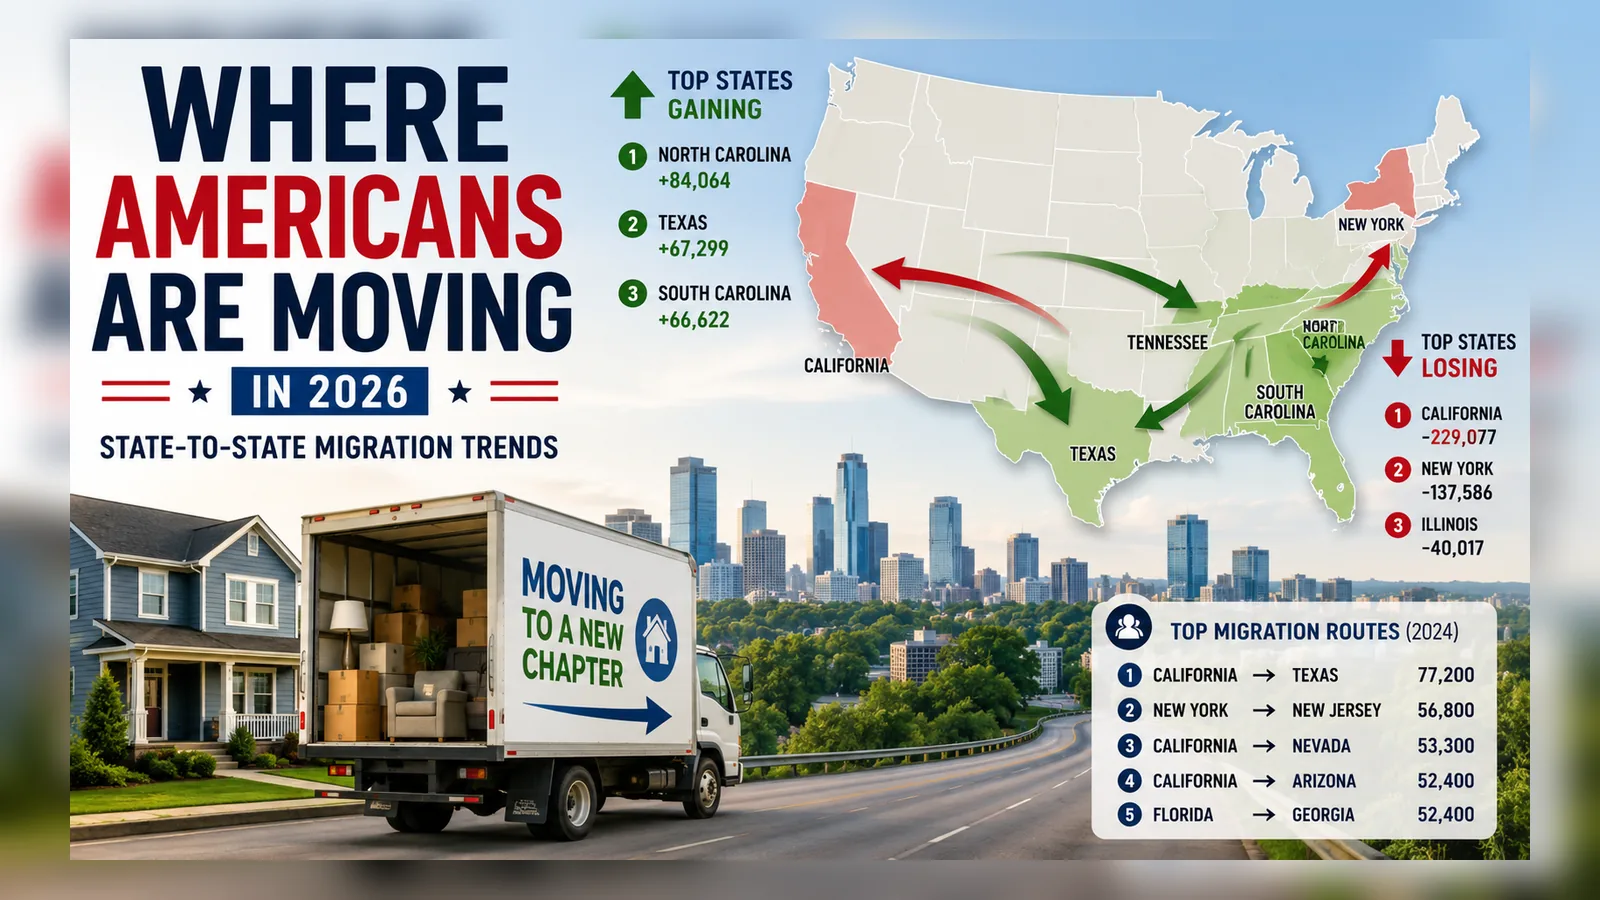
The latest data on where Americans are moving show a continued shift toward parts of the South and Southeast, but the picture is more nuanced than a simple “people are leaving the coasts” narrative.
North Carolina recorded the nation’s largest net gain from domestic migration in the latest Census estimates, adding 84,064 more residents from other U.S. states than it lost between July 2024 and July 2025. Texas followed with a net gain of 67,299, while South Carolina gained 66,622.
At the other end, California recorded by far the largest domestic migration loss at 229,077, followed by New York at 137,586.
Meanwhile, the latest state-to-state flow data show that California to Texas remained the busiest individual interstate migration route, with roughly 77,200 people making that move.
So, to understand where Americans are moving in 2026, we should ask two different questions:
- Which states are gaining or losing the most residents overall through domestic migration?
- Which specific state-to-state routes are carrying the most movers?
This analysis answers both using the latest official Census datasets available in 2026.
For broader research on how population movement affects places and housing markets, see our U.S. Migration Trends research hub.
Where Americans Are Moving: Key Findings
The latest data show:
- North Carolina had the largest net domestic migration gain: +84,064
- Texas ranked second: +67,299
- South Carolina ranked third: +66,622
- California had the largest net domestic migration loss: -229,077
- New York had the second-largest loss: -137,586
- 31 states recorded positive net domestic migration between July 2024 and July 2025
- California → Texas was the largest individual state-to-state flow in the latest ACS data
- Approximately 7.16 million people moved between states in 2024
- About 2.1% of Americans age 1 or older lived in a different state than they had one year earlier
The two Census datasets used here measure different things.
The newest net domestic migration estimates come from the Census Bureau’s Vintage 2025 Population Estimates, covering movement between July 1, 2024, and June 30, 2025.
The newest detailed origin-to-destination flows come from the 2024 American Community Survey, which identifies where residents lived one year earlier.
That distinction matters because a state can have a substantial number of people moving in while also having many residents move out.
States Gaining the Most Residents From Domestic Migration
The latest Census estimates show these states with the largest net domestic migration gains:
| Rank | State | Net Domestic Migration |
|---|---|---|
| 1 | North Carolina | +84,064 |
| 2 | Texas | +67,299 |
| 3 | South Carolina | +66,622 |
| 4 | Tennessee | +42,389 |
| 5 | Arizona | +31,107 |
| 6 | Georgia | +27,333 |
| 7 | Alabama | +23,358 |
| 8 | Florida | +22,517 |
| 9 | Idaho | +19,915 |
| 10 | Nevada | +14,914 |
These figures represent the difference between people moving into a state from elsewhere in the United States and residents leaving that state for another U.S. destination.
They do not include international migration.
The underlying data come from the U.S. Census Bureau’s Vintage 2025 National and State Population Estimates.
North Carolina Is Now the Largest Net Domestic Migration Gainer
North Carolina moved into the top position in the latest Census estimates with a net domestic migration gain of 84,064 people.
That means approximately 84,000 more people moved into North Carolina from elsewhere in the United States than moved out of the state during the year ending June 30, 2025.
North Carolina’s total population grew from about 11.05 million in July 2024 to 11.20 million in July 2025.
It was also the third-fastest-growing state by percentage during that period, behind South Carolina and Idaho.
The state’s performance is particularly significant because it overtook Texas in net domestic migration even though Texas has almost three times North Carolina’s population.
For people considering individual destinations, however, statewide migration does not tell you whether Raleigh, Charlotte, Wilmington, Asheville, or smaller North Carolina markets are experiencing the same housing and affordability conditions.
Migration should always be examined alongside local housing supply, prices, and income.
Texas Is Still One of America’s Largest Migration Magnets
Texas ranked second with 67,299 net domestic migrants.
That remains a large gain, but it represents a substantial slowdown from the extraordinary domestic migration levels Texas recorded earlier in the decade.
Texas’s total population still grew by approximately 391,243 people between July 2024 and July 2025, the largest numerical population increase of any state.
Domestic migration was only one part of that growth.
Texas also benefited from:
- Natural population increase
- International migration
- Continued growth across multiple large metropolitan areas
The state therefore illustrates an important distinction:
Population growth is not the same thing as domestic migration.
A state can grow rapidly even when interstate migration slows because births, deaths, and international migration also affect total population.
Texas remains especially important in interstate migration because it participates in several of the country’s largest state-to-state corridors.
Our guide to moving from California to Texas examines the largest of those corridors in greater detail.
South Carolina Continues to Gain Residents Rapidly
South Carolina ranked third in total net domestic migration with 66,622 additional residents.
But its performance is even more striking relative to the size of its population.
The Census Bureau reports that South Carolina was the fastest-growing state overall between July 2024 and July 2025, increasing by approximately 1.5%.
Domestic migration was the primary driver.
South Carolina’s net domestic migration gain was nearly as large as Texas’s even though Texas has more than five times as many residents.
That makes South Carolina one of the clearest examples of the continued population shift toward portions of the Southeast.
Still, migration does not automatically mean a state remains inexpensive.
Rapid population growth can increase demand for:
- Housing
- Infrastructure
- Schools
- Transportation
- Utilities
- Health care
- Local services
Over time, migration itself can contribute to rising home prices and rents in popular destination markets.
Tennessee, Arizona, and Georgia Remain Major Destinations
The next three states in the ranking were:
- Tennessee: +42,389
- Arizona: +31,107
- Georgia: +27,333
All three have experienced substantial population growth during the 2020s.
Tennessee continues to attract net domestic migration, while cities such as Nashville, Knoxville, and Chattanooga draw households with different employment, lifestyle, and housing priorities.
Arizona’s statewide gain reflects continued movement into a state whose major population centers include Phoenix and Tucson.
Georgia remains another major Southern destination, with Atlanta serving as one of the country’s largest economic and transportation centers.
But net statewide migration should not be interpreted as proof that every housing market within those states is inexpensive or rapidly appreciating.
Local conditions can move very differently from statewide population trends.
For examples of metros where growth and relative affordability overlap, see our Fast-Growing Affordable Metros in the U.S. for 2026.
States Losing the Most Residents Through Domestic Migration
A much smaller group of states experienced the largest net domestic migration losses.
| Rank | State | Net Domestic Migration |
|---|---|---|
| 1 | California | -229,077 |
| 2 | New York | -137,586 |
| 3 | Illinois | -40,017 |
| 4 | New Jersey | -37,428 |
| 5 | Massachusetts | -33,340 |
| 6 | Louisiana | -14,387 |
| 7 | Maryland | -12,127 |
| 8 | Colorado | -12,100 |
| 9 | Hawaii | -8,876 |
| 10 | Connecticut | -5,945 |
California and New York stand far apart from the rest.
Together, the two states recorded a net domestic migration loss of more than 366,000 people during the latest period.
But these figures should not be confused with total population change.
International migration and natural population change can offset domestic migration losses.
New York, for example, had negative domestic migration but still recorded a slight overall population increase between July 2024 and July 2025.
California Still Has the Largest Domestic Migration Loss
California recorded a net loss of 229,077 people, with more leaving for other states than arriving from them.
That was the largest domestic migration loss in the country by a wide margin.
California’s overall population declined slightly between July 2024 and July 2025, falling by about 9,500 residents.
But domestic out-migration is only part of the story.
California simultaneously recorded substantial international migration and natural population increase, both of which offset much of the interstate loss.
It is therefore inaccurate to take the -229,077 domestic migration figure and describe it as California’s total population decline.
The figure specifically measures net movement between California and other parts of the United States.
California is also one of the country’s largest states, so it naturally produces enormous numbers of both inbound and outbound movers.
The state’s size is one reason route-level analysis is useful.
New York Remains the Second-Largest Net Loser
New York recorded a net domestic migration loss of 137,586 people.
Like California, New York still receives large numbers of newcomers while simultaneously sending even larger numbers of residents to other states.
The state’s total population remained roughly stable between July 2024 and July 2025 because international migration and other population components helped offset interstate losses.
New York is also involved in several of the nation’s busiest interstate routes, particularly moves to:
- New Jersey
- Florida
- Pennsylvania
- Connecticut
- Other nearby states
That shows why “people are leaving New York” is only part of the picture.
A substantial amount of migration from New York consists of regional moves rather than cross-country relocation.
Full 50-State Net Domestic Migration Ranking
Here is the complete state ranking for the year ending June 30, 2025:
| Rank | State | Net Domestic Migration |
|---|---|---|
| 1 | North Carolina | +84,064 |
| 2 | Texas | +67,299 |
| 3 | South Carolina | +66,622 |
| 4 | Tennessee | +42,389 |
| 5 | Arizona | +31,107 |
| 6 | Georgia | +27,333 |
| 7 | Alabama | +23,358 |
| 8 | Florida | +22,517 |
| 9 | Idaho | +19,915 |
| 10 | Nevada | +14,914 |
| 11 | Oklahoma | +14,492 |
| 12 | Arkansas | +14,475 |
| 13 | Missouri | +14,028 |
| 14 | Indiana | +12,197 |
| 15 | Ohio | +11,926 |
| 16 | Washington | +9,238 |
| 17 | Minnesota | +8,300 |
| 18 | Maine | +7,406 |
| 19 | Kentucky | +7,269 |
| 20 | Wisconsin | +6,984 |
| 21 | Delaware | +6,855 |
| 22 | New Hampshire | +6,554 |
| 23 | West Virginia | +6,408 |
| 24 | Montana | +6,348 |
| 25 | Virginia | +6,268 |
| 26 | Utah | +3,343 |
| 27 | Oregon | +2,228 |
| 28 | South Dakota | +2,169 |
| 29 | Michigan | +1,796 |
| 30 | Wyoming | +1,474 |
| 31 | North Dakota | +512 |
| 32 | Nebraska | -366 |
| 33 | Kansas | -519 |
| 34 | Vermont | -726 |
| 35 | Mississippi | -917 |
| 36 | Iowa | -970 |
| 37 | Rhode Island | -1,551 |
| 38 | New Mexico | -2,267 |
| 39 | Pennsylvania | -2,936 |
| 40 | Alaska | -4,525 |
| 41 | Connecticut | -5,945 |
| 42 | Hawaii | -8,876 |
| 43 | Colorado | -12,100 |
| 44 | Maryland | -12,127 |
| 45 | Louisiana | -14,387 |
| 46 | Massachusetts | -33,340 |
| 47 | New Jersey | -37,428 |
| 48 | Illinois | -40,017 |
| 49 | New York | -137,586 |
| 50 | California | -229,077 |
A positive figure means more people arrived from other states than left.
A negative figure means more residents departed for other states than arrived.
The District of Columbia is not included in this 50-state table.
What Are the Busiest State-to-State Migration Routes?
Net migration tells us whether a state gained or lost residents overall.
It does not tell us where those movers came from or where departing residents went.
For that, we need the Census Bureau’s separate State-to-State Migration Flows, based on the 2024 American Community Survey.
The largest estimated interstate routes were approximately:
| Rank | Migration Route | Estimated Movers |
|---|---|---|
| 1 | California → Texas | 77,200 |
| 2 | New York → New Jersey | 56,800 |
| 3 | California → Nevada | 53,300 |
| 4 | California → Arizona | 52,400 |
| 5 | Florida → Georgia | 52,400 |
| 6 | Florida → Texas | 52,200 |
| 7 | New York → Florida | 50,700 |
| 8 | Texas → California | 45,400 |
| 9 | Texas → Florida | 45,300 |
| 10 | California → Washington | 43,900 |
These are estimated numbers of people moving in each direction, not net figures.
That distinction is important.
For example:
California → Texas: about 77,200
but:
Texas → California: about 45,400
Both flows were large.
The resulting California–Texas relationship is therefore a major two-way migration corridor, not a one-direction pipeline.
Our moving from California to Texas guide examines the housing, tax, and cost differences behind that specific relocation decision.
Why Large States Can Appear on Both the “Moving In” and “Moving Out” Lists
One of the easiest mistakes in migration analysis is looking only at inbound or outbound totals.
Florida, Texas, and California all receive enormous numbers of interstate movers.
They also send enormous numbers of residents to other states.
In the 2024 ACS flows:
- About 573,900 people moved into Florida from another state
- About 556,200 moved into Texas
- About 406,900 moved into California
At the same time:
- About 661,200 people left California
- About 506,200 left Florida
- About 483,500 left Texas
Large states naturally have more population available to move in both directions.
That is why net migration is usually more useful for determining whether a state is gaining or losing residents from other states.
But even net migration needs context because a gain of 50,000 people has a much larger effect on a small state than on a state with 30 million residents.
Americans Are Moving Across State Lines Less Often
The latest American Community Survey also shows that interstate mobility has declined.
According to the Census Bureau’s 2024 geographic mobility data:
- 11.8% of people age 1 or older lived in a different residence than they had one year earlier
- That was down from 12.1% in 2023
- 2.1% lived in a different state
- That was down from 2.3% in 2023
About 7.16 million people still moved between states in 2024, so interstate migration remains a major force.
But most Americans do not move in a typical year, and among people who do move, most remain within the same state.
That matters for housing markets.
Highly publicized interstate migration routes can reshape particular cities and regions while representing a relatively small share of the national population.
Is the Sun Belt Still Winning?
Broadly, yes, but the pattern is becoming more selective.
Seven of the top 10 states for net domestic migration in the latest data are in the Census South:
- North Carolina
- Texas
- South Carolina
- Tennessee
- Georgia
- Alabama
- Florida
Arizona and Nevada extend the pattern into the Southwest and Mountain West, while Idaho remains another major destination relative to its population.
This continues a multi-year shift toward many Southern and Western states.
However, “Sun Belt growth” should not be treated as one uniform trend.
Florida’s net domestic migration gain, for example, was 22,517, substantially below North Carolina, Texas, and South Carolina.
Some fast-growing destinations from earlier in the decade are therefore seeing slower domestic gains.
Meanwhile, states such as Ohio, Indiana, Wisconsin, and Minnesota also recorded positive net domestic migration.
The current map is not simply Northeast and Midwest losses versus Southern gains.
For households comparing two of the largest Sun Belt destinations, our Texas vs. Florida cost of living analysis shows why migration popularity and household cost are separate questions.
Does Migration Mean Housing Is More Affordable?
Not necessarily.
Migration and affordability interact, but they are not the same measurement.
A state can attract large numbers of residents while simultaneously becoming more expensive.
More households competing for a limited supply of housing can contribute to:
- Higher home prices
- Higher rents
- More construction
- Suburban expansion
- Longer commutes
- Increased infrastructure demand
Likewise, a state with low migration may still contain highly desirable and expensive housing markets.
Our home price-to-income ratio by state comparison shows how dramatically housing affordability differs across states.
For another perspective on statewide living costs, see our Cheapest States to Live in 2026.
For relocation decisions, migration should therefore be treated as one signal, not a recommendation.
A high-migration state is not automatically a better place to live.
What Does Migration Tell Homebuyers and Renters?
Migration can be valuable context because population movement affects housing demand.
A sustained inflow of households can increase demand for:
- Homes for sale
- Rental housing
- New construction
- Schools
- Retail
- Transportation
- Local services
But the effect depends on whether housing supply expands fast enough to absorb that demand.
A rapidly growing market with strong homebuilding may respond very differently from a supply-constrained market receiving the same number of newcomers.
Homebuyers should therefore examine migration alongside:
- Home-price trends
- Inventory
- New construction
- Income
- Property taxes
- Insurance
- Rent
- Employment growth
Our Housing Markets research focuses on those additional market indicators.
Current buyer leverage can also differ sharply across metros regardless of statewide migration trends. Our Best Buyer’s Markets in the U.S. in 2026 examines where buyers currently have more negotiating power.
What Does Migration Tell Someone Planning a Move?
Migration data can help identify places that other households are choosing, but popularity does not determine whether a location suits you.
Before following a migration trend, compare:
Housing:
Can your household afford the specific city or neighborhood?
Income:
Will your salary change after moving?
Taxes:
How will state and local taxes affect your budget?
Insurance:
Are homeowners, auto, or disaster-related insurance costs materially different?
Employment:
Does the area have a strong market for your occupation?
Lifestyle and location:
Does the destination fit your family, commute, and long-term plans?
Use our Compare Places research to evaluate those tradeoffs directly rather than assuming that a high-migration destination is automatically the best choice.
If you’re comparing states on a broader set of livability factors, our Best States to Live in 2026 considers cost, income, employment, education, safety, and health together.
Why Are Americans Moving?
The migration datasets used in this article tell us where people moved.
They do not tell us that any one factor caused the movement from a particular state to another.
That distinction is important.
The Census Bureau separately groups reasons for moving into categories such as:
- Housing-related reasons
- Family-related reasons
- Employment-related reasons
- Other reasons
Housing-related reasons include wanting a newer or larger home, wanting cheaper housing, becoming a homeowner, or seeking a different neighborhood.
Employment reasons can include a new job, job transfer, looking for work, or seeking an easier commute.
Family reasons include household formation and changes in marital or family circumstances.
The Census Bureau’s research on reasons Americans move has historically found housing-related factors to be the largest broad category.
But we should not take that national finding and assume every Californian moving to Texas, every New Yorker moving to Florida, or every household moving to North Carolina had the same motivation.
Migration is the result of millions of individual decisions.
Net Domestic Migration Is Not the Same as Population Growth
This is another critical distinction.
A state’s population changes through three major components:
Natural change
Births minus deaths.
Net international migration
People entering from abroad minus those leaving the United States.
Net domestic migration
People arriving from other U.S. states minus residents leaving for other states.
Texas had the country’s largest total numerical population increase between July 2024 and July 2025 at approximately 391,243 people.
But only 67,299 of that increase came from net domestic migration.
Florida added approximately 196,680 residents overall, while its net domestic migration gain was only 22,517.
North Carolina added approximately 145,907 residents overall, with domestic migration contributing 84,064.
Those differences show why headlines about population growth should not automatically be interpreted as interstate migration.
What Migration Trends Should We Watch Next?
Several patterns will be worth watching as newer data arrive.
Whether North Carolina Maintains the Lead
North Carolina has now surpassed Texas in net domestic migration.
The next Census estimates will show whether that represents a durable shift or a one-year change.
Whether Texas Domestic Migration Continues to Slow
Texas remains one of the largest migration destinations in the country, but its net domestic gain has fallen substantially from earlier peaks.
That could affect housing-demand assumptions in individual Texas markets.
Whether Florida’s Domestic Migration Reaccelerates
Florida remains a huge destination by raw inbound volume, but its net gain has moderated.
Insurance, housing costs, demographic patterns, and changing migration flows could all affect future movement.
Whether California and New York Losses Continue to Narrow
Both states continue to experience large domestic migration losses.
But migration patterns can change as housing markets, employment, and economic conditions shift.
Whether Southern Housing Supply Keeps Pace
Population growth can remain an advantage only if infrastructure and housing expand alongside it.
Rapidly growing markets that fail to add enough housing may gradually lose part of the affordability advantage that helped attract residents.
Methodology and Data Sources
This article deliberately separates two different Census migration datasets.
Net Domestic Migration by State
The 50-state ranking uses the U.S. Census Bureau Vintage 2025 Population Estimates.
Measurement period:
July 1, 2024 through June 30, 2025
Net domestic migration represents:
People moving into a state from elsewhere in the United States minus people leaving that state for another U.S. location.
Source: U.S. Census Bureau Vintage 2025 National and State Population Estimates
State-to-State Migration Routes
Individual origin-to-destination routes use the 2024 American Community Survey 1-year State-to-State Migration Flows.
The Census Bureau released these tables on January 21, 2026.
Source: U.S. Census Bureau State-to-State Migration Flows
This article rounds the route estimates to the nearest hundred people for readability.
Important Limitation
This is a 2026 publication using the newest official data available in 2026.
The figures should not be described as a count of people who physically moved during the calendar year 2026.
The newest net domestic migration data cover the year ending June 30, 2025, while the detailed ACS state-to-state flows measure 2024.
That difference is intentional and clearly identified so newer publication dates are not confused with the actual observation periods.
Frequently Asked Questions
Where are Americans moving in 2026?
The latest official data show the largest net domestic migration gains in North Carolina, Texas, South Carolina, Tennessee, and Arizona. These figures cover the year ending June 30, 2025, and are the newest Census state estimates available in 2026.
What state are the most people moving to?
By net domestic migration, North Carolina ranks first with a gain of 84,064 residents, followed by Texas at 67,299 and South Carolina at 66,622.
What state are the most people leaving?
California recorded the largest net domestic migration loss at 229,077, followed by New York at 137,586.
What is the most popular state-to-state moving route?
The latest Census state-to-state flow estimates show California to Texas as the country’s largest individual interstate route, with roughly 77,200 movers.
Are people still moving to Texas?
Yes. Texas had the second-largest net domestic migration gain in the latest Census estimates at 67,299 and remains one of the largest destinations by raw inbound migration.
Are people still moving to Florida?
Yes. Florida received hundreds of thousands of movers from other states in the latest state-to-state data and recorded positive net domestic migration. Its latest net gain, however, was considerably smaller than North Carolina, Texas, and South Carolina.
Are Americans moving less often?
Yes. The 2024 ACS reports that 11.8% of Americans age 1 or older changed residences, down from 12.1% in 2023. The share moving from another state declined from 2.3% to 2.1%.
Is domestic migration the same as population growth?
No. Total population change also includes births, deaths, and international migration. A state can lose residents to other states and still grow overall if international migration or natural population increase offsets those losses.
Does high migration mean a state is affordable?
No. Migration can increase housing demand and contribute to higher costs. Affordability should be evaluated independently using housing prices, income, taxes, insurance, and local market conditions.
Why are people moving to Southern states?
The migration data themselves do not establish a single cause. Census research shows that Americans move for housing, family, employment, and other reasons. Affordability, job opportunities, and housing preferences may influence individual moves, but those motivations should not be inferred solely from state migration totals.