Fastest Growing States in 2026: All 50 States Ranked by Population Growth

The fastest growing states in 2026 depend on what you mean by “fastest.” South Carolina had the highest population growth rate in the latest Census estimates, but Texas added nearly five times as many people. Those are both legitimate measures of growth, and they tell different stories.
This ranking uses the U.S. Census Bureau’s Vintage 2025 population estimates, released in January 2026. The comparison covers July 1, 2024 to July 1, 2025, the latest completed annual state-estimate period available in 2026. We rank all 50 states by percentage population growth, then use numeric change and migration data to explain what sits behind the percentages.
Fastest-Growing States in 2026
| Rank | State | July 1, 2025 Population | Population Change | Growth Rate |
|---|---|---|---|---|
| 1 | South Carolina | 5,570,274 | +79,958 | 1.46% |
| 2 | Idaho | 2,029,733 | +28,861 | 1.44% |
| 3 | North Carolina | 11,197,968 | +145,907 | 1.32% |
| 4 | Texas | 31,709,821 | +391,243 | 1.25% |
| 5 | Utah | 3,538,904 | +35,921 | 1.03% |
| 6 | Delaware | 1,059,952 | +9,829 | 0.94% |
| 7 | Washington | 8,001,020 | +73,062 | 0.92% |
| 8 | Arizona | 7,623,818 | +67,394 | 0.89% |
| 9 | Nevada | 3,282,188 | +28,645 | 0.88% |
| 10 | Tennessee | 7,315,076 | +63,785 | 0.88% |
| 11 | Georgia | 11,302,748 | +98,540 | 0.88% |
| 12 | South Dakota | 935,094 | +7,984 | 0.86% |
| 13 | Florida | 23,462,518 | +196,680 | 0.85% |
| 14 | North Dakota | 799,358 | +5,971 | 0.75% |
| 15 | Virginia | 8,880,107 | +60,465 | 0.69% |
| 16 | Montana | 1,144,694 | +7,137 | 0.63% |
| 17 | Oklahoma | 4,123,288 | +25,530 | 0.62% |
| 18 | Nebraska | 2,018,006 | +12,415 | 0.62% |
| 19 | Arkansas | 3,114,791 | +18,711 | 0.60% |
| 20 | Alabama | 5,193,088 | +30,033 | 0.58% |
| 21 | Minnesota | 5,830,405 | +33,000 | 0.57% |
| 22 | Indiana | 6,973,333 | +38,579 | 0.56% |
| 23 | Kentucky | 4,606,864 | +22,818 | 0.50% |
| 24 | New Hampshire | 1,415,342 | +6,824 | 0.48% |
| 25 | Maine | 1,414,874 | +6,436 | 0.46% |
| 26 | New Jersey | 9,548,215 | +41,861 | 0.44% |
| 27 | Missouri | 6,270,541 | +26,997 | 0.43% |
| 28 | Kansas | 2,977,220 | +11,968 | 0.40% |
| 29 | Colorado | 6,012,561 | +24,059 | 0.40% |
| 30 | Connecticut | 3,688,496 | +14,047 | 0.38% |
| 31 | Rhode Island | 1,114,521 | +4,106 | 0.37% |
| 32 | Wyoming | 588,753 | +2,031 | 0.35% |
| 33 | Ohio | 11,900,510 | +39,889 | 0.34% |
| 34 | Maryland | 6,265,347 | +20,033 | 0.32% |
| 35 | Michigan | 10,127,884 | +27,922 | 0.28% |
| 36 | Wisconsin | 5,972,787 | +15,619 | 0.26% |
| 37 | Iowa | 3,238,387 | +7,933 | 0.25% |
| 38 | Massachusetts | 7,154,084 | +15,524 | 0.22% |
| 39 | Oregon | 4,273,586 | +8,262 | 0.19% |
| 40 | Mississippi | 2,954,160 | +3,988 | 0.14% |
| 41 | Illinois | 12,719,141 | +16,108 | 0.13% |
| 42 | Pennsylvania | 13,059,432 | +13,584 | 0.10% |
| 43 | Alaska | 737,270 | +733 | 0.10% |
| 44 | Louisiana | 4,618,189 | +3,311 | 0.07% |
| 45 | New York | 20,002,427 | +1,008 | 0.01% |
| 46 | California | 39,355,309 | -9,465 | -0.02% |
| 47 | New Mexico | 2,125,498 | -1,276 | -0.06% |
| 48 | West Virginia | 1,766,147 | -1,255 | -0.07% |
| 49 | Hawaii | 1,432,820 | -2,132 | -0.15% |
| 50 | Vermont | 644,663 | -1,858 | -0.29% |
Source and calculation: Population totals come from the U.S. Census Bureau Vintage 2025 state population estimates. Real Estate Lynx calculates each state’s growth rate from the Census Bureau’s July 1, 2024 and July 1, 2025 population estimates and ranks the 50 states by that exact rate. The Census Bureau’s published headline percentages are rounded to one decimal place, so our two-decimal calculation helps separate states that appear tied after rounding. Washington, D.C. is excluded because this article ranks states.
South Carolina Won the Rate Race. Texas Won the Headcount Race.
The most useful way to read the table is to compare the first and fourth rows.
South Carolina grew by about 1.46%, the fastest rate among the states. Its population increased by 79,958, reaching approximately 5.57 million.
Texas grew by a slightly slower 1.25%, but that percentage was applied to a much larger population base. The state added 391,243 residents, more than any other state, bringing its estimated population to about 31.71 million.
That distinction is easy to miss in “fastest growing” lists. A smaller state can lead by percentage because a moderate number of new residents represents a large share of its starting population. A large state can add far more people while posting a lower percentage rate.
The Census Bureau’s own release makes the same distinction. Its 2024-to-2025 tables rank South Carolina first by percentage growth and Texas first by numeric growth. Census reported that Florida was second by people added at 196,680, followed by North Carolina at 145,907, Georgia at 98,540, and South Carolina at 79,958.
The Top Five Grew for Different Reasons
The first five states in the percentage ranking were South Carolina, Idaho, North Carolina, Texas, and Utah. Their positions look similar in a table, but the demographic forces behind them were not identical.
South Carolina: Domestic Migration Did Most of the Work
South Carolina’s population increased by nearly 80,000 people. Census says a net domestic migration gain of 66,622 was a major driver of that increase.
That means the state’s leading growth rate was closely connected to people moving in from elsewhere in the United States, not simply births or international migration.
Idaho and North Carolina: Strong Rate Growth With Domestic Inflows
Idaho grew by about 1.44%, adding 28,861 residents. North Carolina increased by about 1.32%, adding 145,907.
Census identified both states, along with South Carolina, as places where domestic migration played an important role in their growth.
North Carolina is especially notable because it ranked near the top on both measures. It was third by percentage growth and third by people added.
Texas: Scale Changes the Meaning of Growth
Texas added 391,243 residents, by far the largest numeric increase in the country.
Census says Texas’s growth came from a combination of natural change, meaning births minus deaths, and net international migration. The state therefore illustrates why total population growth cannot be reduced to domestic migration alone.
Utah: Natural Change Still Matters
Utah grew by about 1.03%, adding 35,921 residents.
Census says Utah’s increase was driven mainly by natural change. In other words, births exceeding deaths contributed more to growth than migration did during the latest period.
These differences matter because population growth is an outcome. The underlying demographic process can vary substantially from one state to another.
The States That Added the Most People
If the question is “Which states gained the most residents?” rather than “Which states grew fastest by percentage?”, the ranking changes dramatically.
The five largest numeric gains were:
- Texas: +391,243
- Florida: +196,680
- North Carolina: +145,907
- Georgia: +98,540
- South Carolina: +79,958
Washington, Arizona, Tennessee, Virginia, and New Jersey completed the Census Bureau’s top 10 by numeric growth.
Florida is a good example of why the two rankings should not be confused. It added almost 197,000 residents, second only to Texas, yet its percentage growth rate was about 0.85%, placing it 13th in our 50-state rate ranking.
For broader context on how population shifts and migration patterns differ, explore our U.S. Migration Trends hub. The final section also points to our state-to-state domestic migration analysis for readers who want to separate movement between states from total population change.
Five States Lost Population
Forty-five states grew between July 2024 and July 2025. Five did not.
Vermont had the largest percentage decline at approximately -0.29%, losing 1,858 residents.
Hawaii declined by about -0.15%, or 2,132 people.
West Virginia fell about -0.07%, losing 1,255 residents.
New Mexico declined by roughly -0.06%, or 1,276 people.
California was nearly flat but still negative at about -0.02%, a decline of 9,465 residents.
California’s result is another useful reminder about scale. Its percentage loss was tiny, but because its population exceeds 39 million, the numeric decline was larger than the losses in the other four shrinking states.
New York sat just above the line. It added only 1,008 residents, a growth rate of roughly 0.01%.
Population Growth Slowed Almost Everywhere
The 2025 period was not simply a year of winners and losers. It was a year when growth slowed across most of the country.
The Census Bureau estimated that the U.S. population increased by about 1.8 million people, or 0.5%, from July 1, 2024 to July 1, 2025. A year earlier, the country had grown by roughly 3.2 million, or 1.0%.
The major reason was a sharp decline in net international migration. Census estimated net international migration at about 1.3 million during the latest period, down from approximately 2.7 million the year before.
An independent Pew analysis of the Vintage 2025 estimates found that growth rates slowed in 48 states and that 30 states grew more slowly than their longer-term trends.
This broader slowdown helps explain why several states with positive growth still posted relatively small gains.
The Regional Picture Is More Complicated Than “Sun Belt Growth”
The South remained the fastest-growing Census region, but its growth rate slowed to about 0.9% from 1.4% the prior year.
The Northeast grew only about 0.2%, after a stronger 0.8% increase the year before.
The Midwest offered one of the more interesting changes. Every Midwestern state gained population, and Census reported positive net domestic migration into the region for the first time this decade.
The West was mixed. Idaho, Utah, Arizona, Nevada, and Washington ranked high in the state growth table, yet California, Hawaii, and New Mexico were among the five states that lost population.
Pew’s analysis reaches a similar conclusion: the South remained the fastest-growing region, the Midwest showed a notable domestic-migration improvement, and the West contained both some of the fastest-growing and shrinking states.
That is a better description of the 2026 data than a simple “people are moving South and West” narrative.
Population Growth Is Not the Same as Domestic Migration
This distinction is central to the article. A state’s population changes through several components:
- births;
- deaths;
- people moving in from other states;
- people moving out to other states;
- international immigration;
- international emigration.
Census refers to births minus deaths as natural change. It separately estimates net domestic migration and net international migration.
A state can therefore lose residents to other states and still gain population overall if births and international migration offset the domestic loss.
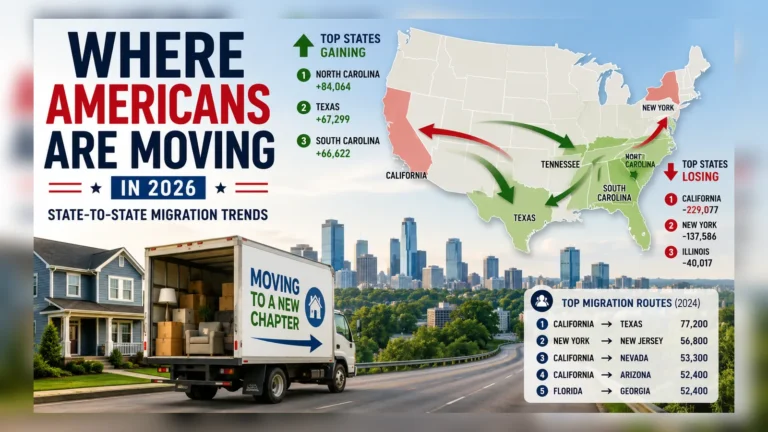
New York is a useful example. Our Where Americans Are Moving in 2026 research shows substantial negative domestic migration, yet New York still recorded a slight total population increase in the latest Census estimates.
The reverse can also happen. A state can attract domestic migrants but still grow slowly if deaths exceed births or other components weaken.
That is why this population-growth analysis and our domestic-migration analysis answer different questions even though both involve population movement.
Why Growth Matters for Housing, but Does Not Predict Prices by Itself
Population growth can increase housing demand because more households need places to live. But population growth alone does not determine what happens to home prices or rents.
Housing outcomes also depend on:
- how quickly new homes are built;
- vacancy rates;
- household formation;
- incomes;
- mortgage rates;
- local employment;
- zoning and development constraints;
- the type and location of available housing.
A fast-growing state that builds housing quickly may absorb population increases differently from a state where supply expands slowly.
That is why population growth should be treated as one housing-market input, not a direct forecast.
Our Fast-Growing Affordable Metros in the U.S. for 2026 research looks at a more local level where population growth and housing costs can be compared together. The U.S. Cities & Metro Areas hub provides additional geographic context, while the U.S. States hub organizes broader state-level housing, cost, and migration research.
A Current-Year Ranking Requires a Date Explanation
There is one important timing detail behind every “fastest growing states 2026” page.
The Census Bureau does not yet have a completed July 1, 2026 annual state population estimate. The newest full annual state release available in 2026 is Vintage 2025, published January 27, 2026.
That dataset estimates population as of July 1, 2025 and compares it with July 1, 2024.
Calling this a 2026 ranking therefore means it uses the latest official annual state estimates available to readers in 2026. It does not mean the table measures population change through July 2026.
This distinction is important because different publishers sometimes use “2026” in the title while ranking growth over much longer periods such as 2010-to-present or 2020-to-present. Those are valid analyses, but they answer a different question.
Methodology
We use U.S. Census Bureau Vintage 2025 population estimates for this ranking. The Census Bureau released the dataset on January 27, 2026. It includes an internally consistent time series of state population estimates through July 1, 2025.
For each state, we calculate:
Population growth rate = (July 1, 2025 population – July 1, 2024 population) ÷ July 1, 2024 population × 100
We rank the 50 states from highest to lowest using the exact calculated percentage. The article displays the result to two decimal places.
This produces slightly more detail than the Census Bureau’s published headline table, which rounds growth to one decimal place. Our top-five order matches the Census Bureau’s official percentage-growth ranking.
Washington, D.C. is excluded because this article ranks states. We do not combine data from older Census vintages. Census notes that each new population-estimate vintage can revise prior post-2020 estimates and advises making year-to-year comparisons within the same vintage.
Primary sources are the Census Bureau’s Vintage 2025 state population datasets and its January 2026 population-growth release. Regional and longer-term interpretation was independently cross-checked against Pew’s analysis of the Vintage 2025 estimates.
Questions About the Fastest Growing States
What is the fastest-growing state in 2026?
South Carolina ranks first using the latest Census annual estimates, with population growth of approximately 1.46% from July 1, 2024 to July 1, 2025.
Which state added the most people?
Texas added the most residents, gaining 391,243 people over the same period. It ranked fourth by percentage growth at about 1.25%.
Which states are losing population?
Five states declined in the latest Census estimates: Vermont, Hawaii, West Virginia, New Mexico, and California.
Is population growth the same as people moving into a state?
No. Population growth includes natural change, domestic migration, and international migration. A state can gain population even while losing residents to other states.
Why does a 2026 ranking use 2025 population estimates?
The Census Bureau’s Vintage 2025 release, published in January 2026, is the latest completed annual state population dataset available in 2026. It measures change from July 1, 2024 to July 1, 2025.
The Growth Story Is Really Two Stories
South Carolina was the fastest-growing state by percentage. Texas added the most people. Both statements are true, and together they explain why a useful population-growth ranking needs more than one column.
The latest Census estimates also show a broader shift: most states are still growing, but the national pace slowed sharply as international migration fell. Domestic migration, natural change, and international migration now play different roles from state to state.
For the next step, see our Where Americans Are Moving in 2026 analysis to separate total population growth from state-to-state domestic migration.