
Housing Risk: Climate Hazards, Insurance Costs & Resilience
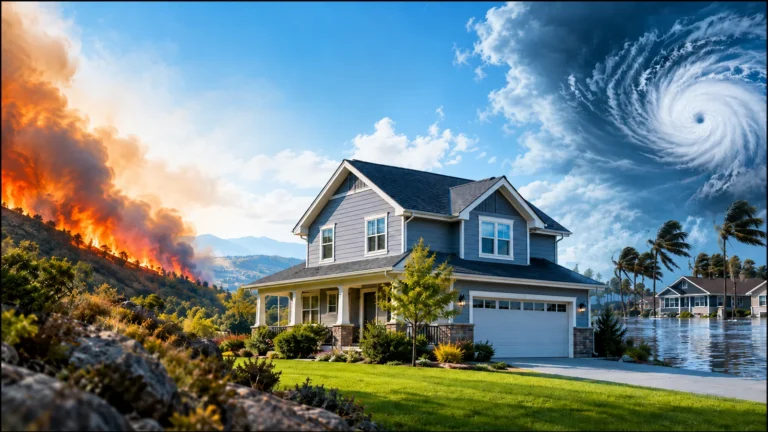
Housing risk is not a single score or a prediction that a home will suffer damage. It describes how natural hazards, the locations of people and buildings, the ability to withstand disruption, and the resources available for recovery can interact. Two communities may face the same kind of storm yet have very different housing losses, insurance choices and recovery times.
Understanding housing risk helps readers compare the exposure of U.S. places, interpret hazard maps and insurance conditions, and weigh possible consequences for housing affordability and local markets. It also requires a boundary: a state or county map can help identify questions to investigate, but it cannot establish the safety, insurability or value of an individual property.
This guide explains the major hazards affecting housing, what risk data actually measure, why resilience matters and how to use geographic evidence without overstating its precision.
What Is Housing Risk, and How Is It Different From Resilience?
A housing-related hazard is a potentially damaging event or condition, such as a flood, wildfire, windstorm or earthquake. Housing risk concerns the possible consequences when people, homes and infrastructure may be affected. Resilience is the capacity to prepare, withstand disruption, respond, recover and adapt. A place can experience substantial hazard exposure while reducing some consequences through sound construction, reliable infrastructure and effective emergency services.
| Concept | The question it answers | Housing example |
|---|---|---|
| Hazard | What potentially damaging event could occur? | River flooding, extreme heat or earthquake shaking. |
| Exposure | Who or what is situated where it could be affected? | Homes and roads within a flood-prone area. |
| Vulnerability | How susceptible are those people or assets to harm? | Older infrastructure, limited recovery resources or susceptible building systems. |
| Resilience | How well can a community limit disruption and recover? | Reliable utilities, appropriate construction, emergency services and financial capacity. |
These concepts should not be used as synonyms. A severe storm does not create the same loss everywhere it passes. Exposure differs by location; vulnerability and recovery capacity differ among communities and households. Even two neighboring buildings can have different outcomes because of elevation, construction, drainage or maintenance.
An insurance premium is also not a universal risk score. It reflects policy coverage, insurer pricing and regulatory and market conditions as well as aspects of the insured property and hazards.
Which Natural Hazards Can Affect U.S. Housing?
Different hazards act through different mechanisms. Some directly damage buildings; others can disrupt utilities, affect insurance markets or increase the recurring cost of occupying a home. The relevant question is not whether a hazard appears on a national list, but how the hazard, geography and exposed housing interact.
Flooding, flood zones and coastal change
Flooding can arise from overflowing rivers, heavy rainfall, drainage limitations, flash floods and coastal storm surge. It can affect foundations, building systems, roads and personal belongings, sometimes forcing temporary relocation. Homes close to each other may face different flood exposure because of terrain, elevation, drainage and building configuration.
FEMA flood maps identify mapped hazard zones and support floodplain management and certain insurance requirements. They are not a complete guarantee of parcel-level future flood performance. A property outside a mapped high-risk zone can still flood. The National Flood Insurance Program’s flood-zone guidance explains different designations and why lower mapped risk is not zero risk.
Coastal housing may face overlapping challenges: storm surge, erosion, higher tides, saltwater intrusion and damage to roads or water systems. Long-term coastal change can affect both the property and access to essential services. A coastline’s risk should not be generalized to every neighborhood or inland parcel in the same county.
Hurricanes, severe thunderstorms, tornadoes and hail
Hurricanes can produce damaging wind, storm surge, heavy rainfall, tornadoes and prolonged outages. Storm impacts can extend far inland, so distance from the shoreline is not a sufficient description of risk. The National Hurricane Center’s hurricane hazard guidance distinguishes wind, surge and freshwater flooding.
Severe thunderstorms, hail and tornadoes may be highly localized but consequential for roofs, windows, siding, utilities and nearby infrastructure. Historical regional storm frequency helps identify broad patterns; it cannot predict whether a particular building will be hit during a specified future year. Building condition, local standards and emergency access can affect consequences.
Wildfires and smoke
Wildfire exposure depends on vegetation, weather, topography, the built environment and proximity to potential fire spread. Housing effects can include fire damage, smoke, evacuations, road closures, utility interruptions and insurance-market changes. Wildfire-prone regions are not uniformly dangerous at the same level: local layout and building characteristics matter.
Managing vegetation, using suitable materials and planning evacuation routes can be relevant to resilience, but any particular construction or land-management intervention requires applicable local rules and expert property-specific advice. A regional wildfire score should not be turned into a guarantee about individual structures.
Extreme heat, drought and water scarcity
Extreme heat may increase cooling needs and electricity demand, while outages or inefficient buildings can amplify household consequences. Shade, insulation, ventilation and access to reliable cooling can change exposure. The National Weather Service provides heat-risk guidance for understanding potential impacts; a short-term weather outlook is not the same as a long-term housing-risk assessment.
Drought and water scarcity can affect utility supplies, landscaping, public infrastructure, development capacity and costs. The consequences differ according to water sources, storage, conservation, governance and local demand. High average temperatures or dry conditions do not establish the same risks for every household in a region.
Winter storms, earthquakes and landslides
Heavy snow, ice and prolonged freezing can disrupt heating, transport, water systems and roofs. Winter preparedness depends partly on local infrastructure and construction standards, not only the number of cold days.
Earthquake shaking, soil conditions and potential ground failure present a different hazard category. The U.S. Geological Survey’s 2023 50-state National Seismic Hazard Model estimates potential shaking for specified probabilities and supports codes and planning. It is not a damage prediction for an individual building. Earthquakes, heavy rain, erosion and wildfire-related changes to landscapes can also contribute to landslide hazards in some locations.
How to Read Housing Risk Maps, Historical Losses and Models
Risk data come from different sources and answer different questions. Before comparing locations, distinguish maps of hazard, measures of exposure, modeled potential loss, observed historical damage and indicators of community resilience.
| Evidence type | What it can tell readers | What it cannot establish by itself |
|---|---|---|
| Hazard map | Locations with modeled or documented potential for a specified event | Whether an individual structure will be damaged. |
| Historical loss records | Losses recorded over a defined past period | The precise probability of future loss, especially as conditions change. |
| Modeled expected losses | Estimated losses under a documented model and assumptions | An actual insurance premium or guaranteed outcome. |
| Insurance-market information | Availability, price ranges, policy terms and underwriting conditions in a market | Coverage and price for a particular address without a quote. |
| Community vulnerability and resilience measures | Conditions that may increase disruption or support recovery | An individual household’s personal circumstances or future experience. |
For example, FEMA’s National Risk Index technical documentation (December 2025, version 1.20) describes a community-oriented framework involving expected annual loss, social vulnerability and community resilience. These are distinct components. A county or census-tract ranking is not an inspection report, an insurer’s underwriting decision or proof that every address in the geography has the same risk.
Geographic scale matters. State averages can mask differences among coastal and inland areas. County measures may conceal differences between adjacent neighborhoods. Street-level conditions and building-level systems may require separate verification. Two datasets should not be compared as though they describe the same risk when their map boundaries, hazard definitions, dates or methods differ.
Reporting periods matter as well. Historical loss series describe the years actually covered, not automatically the current year’s conditions. NOAA announced in May 2025 that its Billion-Dollar Weather and Climate Disasters product would not be updated beyond calendar year 2024. The archived 1980 to 2024 records can support historical comparisons, but they do not include events from later years. Readers researching subsequent periods should consult appropriately dated sources.
Housing Risk by State, Metropolitan Area and Neighborhood
A geographic comparison should start at the scale of the decision. At the state level, it may be useful to understand broad climate exposure, public infrastructure and insurance-market conditions. The U.S. States collection provides geographic context, but broad indicators should not be assigned mechanically to every address within a state.
At the city or metro level, consider whether a region’s hazards concentrate in particular floodplains, coastlines, hillsides or built environments. Transport routes, drainage capacity and emergency services may vary within a metro area. Metro-level research offers another geographic lens.
Neighborhood-level examination may reveal changes in elevation, road access, nearby vegetation, drainage and housing types. Even then, general neighborhood information does not replace a property-specific assessment. For local context, see Neighborhoods & Suburbs.
A practical comparison should use a consistent hazard definition, comparable geography and the same or suitably aligned reporting periods. If one source ranks counties and another reports state insurance averages, explain the mismatch rather than combining them into a single unsupported safety ranking.
Flood Insurance, Homeowners Coverage and Availability
Natural-hazard exposure can have financial consequences even where a property has not experienced a recent loss. Homeowners may encounter premiums, deductibles, restrictions, nonrenewals or fewer coverage options. Availability, cost and actual coverage are separate questions.
Flood insurance and mortgage requirements
Most standard homeowners policies do not cover ordinary flood damage. The National Flood Insurance Program’s coverage overview explains why separate flood coverage matters. In NFIP-participating communities, federal flood-insurance purchase requirements generally apply when a building in a designated Special Flood Hazard Area secures a qualifying loan from a federally regulated lending institution or federal agency. The requirement depends on the specific property’s designation and loan circumstances, and other lenders may apply additional requirements. Being outside that zone does not mean flood insurance is unnecessary for everyone.
Property owners and buyers should confirm current flood maps, loan conditions, policy exclusions and insurance terms with the relevant professionals. Renters should separately assess coverage for belongings and temporary disruption; a landlord’s building policy should not be assumed to cover tenants’ possessions.
Premiums, deductibles, nonrenewals and insurer choices
Insurance costs may reflect hazard exposure, construction and replacement costs, claims experience, roof condition, policy limits, deductibles, insurer strategy and state regulation. Some policies have separate windstorm, hurricane or hail deductibles, sometimes stated as a percentage rather than a fixed amount. A lower annual premium may come with substantially greater cost after a covered event.
When private coverage is difficult to obtain, some markets have state-established residual mechanisms or other specialized options. Their eligibility and coverage rules vary, and availability is not guaranteed. An insurer’s nonrenewal can be disruptive even when other coverage exists, because replacement terms and prices may differ. The NAIC homeowners insurance resources explain common policy and deductible concepts; state insurance departments are relevant for current state-specific protections and questions.
For numerical state comparison, consult Home Insurance Rates by State in 2026. That analysis addresses modeled ownership costs, not the exact premium or availability for any one address.
Community Resilience: Buildings, Utilities and Recovery Capacity
Risk is not limited to the exterior of a house. A structurally robust building may still experience serious disruption if nearby roads flood, electricity is interrupted, drinking-water systems fail or emergency services cannot reach the community. The ability to recover is shaped by infrastructure and access to support.
| Resilience factor | Why it matters for housing | Scope to verify |
|---|---|---|
| Building standards and upkeep | Appropriate design and condition may reduce damage from some hazards | Local code version, construction and building history. |
| Electricity and communications | Outages affect cooling, heat, refrigeration, communication and some medical equipment | Utility reliability and outage-recovery capacity. |
| Water, drainage and sewer systems | Service failures can affect habitability during flood, freeze or drought | Local infrastructure and system conditions. |
| Roads and transport | Limited routes can delay evacuation, access to work and recovery | Local geography and emergency management plans. |
| Emergency and healthcare services | Response capacity and accessibility affect how disruption is managed | Coverage, distance and staffing realities. |
| Insurance and household resources | Financial resources influence repair and temporary housing choices | Policy terms, affordability and available support. |
Construction standards and resilience improvements can be important, but the value of a particular roof, window, elevation treatment or wildfire buffer varies by hazard, property and applicable codes. This article cannot substitute for professional inspections or detailed repair instructions.
Displacement can disrupt schools, employment, support networks and daily routines. Recovery may impose financial strain and emotional stress, particularly when housing alternatives and essential services are scarce. These are relevant community and household considerations; aggregate disaster figures alone do not tell us how any individual will experience disruption.
For households with children, renters, older adults or people who depend on reliable utilities or medical services, access to transport, support and temporary accommodation may be especially consequential. Conditions and capacity matter more than assumptions based on age or household type alone.
How Housing Risk Can Affect Affordability and Home Values
Housing risk can influence market outcomes through insurance pricing, repair expectations, financing, infrastructure expenditure and buyer preferences. Yet a risky location does not automatically have falling home prices, nor does a high-priced location necessarily have low hazard exposure.
Consider two hypothetical communities exposed to comparable storms. Community A has greater access to suitable temporary housing, better-supported transport and utilities, and easier access to insurance. Community B faces constrained supply, infrastructure backlogs and insurance nonrenewals. Their housing costs, rental pressures and recovery paths may differ significantly. This is an illustrative comparison, not a measured finding or prediction about any named place.
Mortgage lenders often require property insurance appropriate to loan terms, and some hazards may trigger additional coverage requirements. If coverage becomes much more expensive or difficult to obtain, ownership and financing can be affected. Property values may respond unevenly because location amenities, employment, supply and demand also matter. Liquidity can change when fewer qualified buyers are able or willing to complete a purchase.
The full cost of living in a place may also include cooling or heating, water, transport, repairs and potential disruption. See Housing Affordability for the wider housing-cost framework and Cost of Living & Affordability for other household expenses. The Texas vs. Florida Cost of Living 2026 comparison illustrates why ownership expenses can differ across destinations, but should not be interpreted as a property-specific hazard ranking.
For broader price, inventory and supply analysis, consult U.S. Housing Markets. Risk and insurance are components of the wider market, not stand-alone explanations of every price movement.
Does Hazard Exposure Determine Where People Move or Live?
Not necessarily. Employment, family, housing availability, taxes, lifestyle, access to services and prices may all influence where households live. A community with significant hurricane, heat or wildfire exposure can remain attractive because of other advantages, while a location with less exposure to one hazard may face different challenges.
For geographic population movement, see U.S. Migration Trends. For practical household planning, see Moving & Relocation. Neither an aggregate migration statistic nor a hazard map provides a complete personal moving recommendation.
Hazard exposure can be considered alongside schools, commuting, healthcare and quality of life when reviewing Best Places to Live. A responsible comparison identifies trade-offs; it does not call a place universally safe or unlivable based on one measure.
A Practical Framework for Comparing Housing Risk
When examining a location, use a sequence that keeps hazard data, financial costs and personal circumstances distinct:
- Define the geography. Are you reviewing a state, county, metro, neighborhood or specific address? Do not transfer a broad average directly to a home.
- List the relevant hazards. River flood, coastal surge, wildfire, severe weather, heat, drought and earthquake shaking require different evidence.
- Identify each source and its date. Separate historical losses from predictive models and identify actual reporting periods and update status.
- Check exposure and vulnerability. A hazard may be present while building characteristics, infrastructure and local conditions materially affect consequences.
- Review insurance separately. Verify potential coverage, exclusions, flood obligations, deductibles, availability and actual property-specific quotes.
- Consider local resilience. Examine roads, utilities, water, emergency response and access to temporary housing or support networks.
- Compare the broader trade-offs. Include home prices, rent, income, household expenses and personal circumstances, without treating a risk score as a destination ranking.
For a particular purchase or existing property, appropriate next steps may include reviewing disclosures, official local maps and insurance documents and obtaining qualified inspections or engineering advice where warranted. Exact requirements depend on local rules, lender terms and property conditions; regional research cannot certify an individual property.
Frequently Asked Questions About Housing Risk
Is a home outside a FEMA high-risk flood zone safe from flooding?
No. Flood maps identify specified modeled zones, but flooding can occur outside designated high-risk areas because of rainfall, drainage, changing conditions and other factors. A mapped lower-risk designation should not be interpreted as zero flood exposure. The property’s location, coverage and flood history require separate verification.
Does a high community risk score mean every home is high risk?
No. Community-level scores aggregate data over defined areas and may combine hazard exposure, expected losses, vulnerability and resilience indicators. They do not assess the exact construction, elevation, coverage or price of every house within a census tract or county.
Are homeowners insurance and flood insurance the same thing?
No. Standard homeowners policies generally exclude flooding, while separate flood insurance addresses covered flood losses under its own terms and limitations. Requirements depend on flood designation and loan circumstances. Neither type of policy should be assumed to cover all disaster-related costs.
Can a place with considerable hazard exposure still be resilient?
Yes. Resilience depends on how buildings, infrastructure, institutions and households prepare for, withstand and recover from hazards. The presence of risk does not determine a community’s recovery capacity or make it universally unsuitable for housing.
Explore Housing Risk and Related Research
Use these published resources to examine complementary questions without treating any single measure as a complete housing-risk assessment:
- Insurance and recurring ownership costs: Home Insurance vs Property Taxes by State in 2026 compares two ongoing housing-cost categories across states.
- City and metropolitan context: U.S. Cities & Metro Areas provides a starting point for examining regional differences.
- Broader housing-market forces: Housing Economy, Migration & Development explains economic conditions beyond hazards and insurance.
- Location comparisons: Compare Places supports wider place comparisons alongside risk evidence.
Research Limitations and Source Verification
Hazard maps, statistical models, insurance market data and observed losses differ in their coverage, geographic precision and reference periods. A national or county estimate cannot establish a property’s exposure or future damages, and a model can change when new evidence or assumptions become available. Insurance laws, policy terms, lending rules and prices may also change.
For important decisions, check the original agency publication, geographic boundary, model or data vintage, measurement unit, limitations and present applicability. Confirm property-specific details with the relevant official records, insurer, lender or qualified professional. Our Editorial Policy explains our broader approach to evaluating sources and research limitations.
Housing risk becomes more useful when readers connect hazards, exposure, vulnerability, resilience, insurance conditions and local housing realities while keeping their different measurements and levels of certainty clear. That gives a more credible basis for understanding U.S. housing markets than treating a single hazard map, average insurance premium or risk score as the whole story.