
U.S. Housing Supply & Development: Inventory, Construction, Shortages & Growth
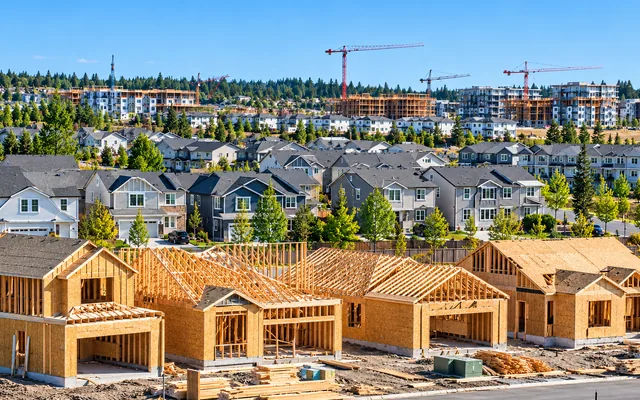
Housing supply affects how easily people can find homes to buy or rent, how quickly communities can respond to population and household growth, and how much pressure demand places on prices and rents.
But “housing supply” is broader than the number of homes currently listed for sale or available for lease.
A complete view includes the existing housing stock, homes that are vacant or available, units moving through the development pipeline, and the new homes that are ultimately completed.
It also requires looking at where those homes are located, what types of households they serve, and how quickly new construction can respond when demand changes.
This guide explains how housing supply works across the United States, how the main supply measures differ, and how construction, vacancy, migration, affordability, and local development conditions interact. For broader economic context, explore Housing Economy, Migration & Development.
This coverage focuses on place and market intelligence. It does not provide real estate development, underwriting, financing, construction-management or investment advice.
What Is Housing Supply?
At its broadest, housing supply is the total stock of housing units within a defined market, whether those units are occupied or vacant. For practical market analysis, it is also useful to examine how much of that stock is currently available and the development pipeline that can add new units over time.
Housing development is the process that adds new homes to the stock. New development can take many forms, from detached houses and townhomes to apartment buildings and other multifamily properties.
Several related terms are often used as though they mean the same thing, but they do not:
- Housing stock is the total number of housing units in a defined area.
- Housing inventory usually refers more narrowly to homes currently available for sale or rent, depending on the dataset.
- New housing construction measures units moving through development.
- Vacancy measures unoccupied units under a particular survey definition.
- Housing supply growth reflects how the stock changes over time, not simply how many units were newly built.
Understanding those distinctions is essential because one measure can improve while another remains tight.
Housing Supply vs. Housing Inventory
Housing supply and housing inventory overlap, but they answer different questions.
A market can have a large total housing stock and still have very little active inventory for buyers if only a small share of that stock is listed for sale. Available homes can also be concentrated in price ranges or locations that do not match current demand.
A similar distinction applies to rentals. A city can have a large rental stock overall but relatively few units that are vacant or immediately available for lease.
Inventory therefore gives a more immediate view of market availability. Housing supply is the broader concept: it includes the existing stock, current availability, and the ability of the market to add or lose units over time.
That distinction matters when interpreting headlines about “more supply.” A rise in listings can improve short-term buyer choice without meaning that the underlying housing stock has expanded materially.
Conversely, a large construction pipeline can point to future supply growth even before those units are available for occupancy.
Housing Stock vs. New Construction
New construction is one way the housing stock grows, but gross construction is not the same as net growth.
A community can complete thousands of new units while also losing housing through demolition, redevelopment, conversion to nonresidential use, disaster damage or other changes.
Existing structures can also be reconfigured so that the number of housing units increases or decreases without conventional ground-up construction.
For long-run analysis, the useful question is not only “How many homes were built?” but also “How much did the total housing stock change?”
That is why construction statistics and housing-stock estimates serve different purposes. Construction data help track the pipeline. Housing-stock estimates help show the cumulative result after additions and losses.
The Census Bureau documents the methods used to produce its Population and Housing Unit Estimates.
For a Census-based state comparison of changes in the estimated housing stock, see Housing Growth by State in 2026: All 50 States Ranked.
Understanding the Housing Supply Pipeline
New housing does not appear all at once. Residential development moves through several stages, and each stage answers a different question.
The main construction-pipeline measures include:
- building permits;
- units authorized but not yet started;
- housing starts;
- units under construction;
- housing completions.
A permit is an early signal that construction has been authorized. A start records when construction begins under the applicable statistical definition. A unit under construction is farther along the pipeline. A completion marks the end of the construction process.
The stages can move differently from one another. Permits may rise while starts remain restrained. Starts may increase while completions lag because projects take time to build. Completions can remain elevated even after new permits weaken because previously started projects are still being finished.
That timing is one reason no single construction statistic is sufficient for understanding housing supply.
Which Housing-Supply Metric Answers Which Question?
Different measures are useful for different tasks.
If the question is “How much housing is available right now?”, active for-sale or rental inventory is usually most direct, while vacancy measures provide a complementary view under the definition used by the underlying survey.
If the question is “What may be coming next?”, permits, authorized-but-not-started units, starts and units under construction can help describe the pipeline.
If the question is “How many new homes are being delivered?”, completions are more directly relevant.
If the question is “How has a place’s long-run housing capacity changed?”, housing-stock estimates and net housing growth are more appropriate.
The key is to match the metric to the question rather than treating every supply statistic as interchangeable.
Building Permits
Building permits are one of the earliest widely available indicators of potential new residential construction.
The U.S. Census Bureau’s Building Permits Survey provides national, state, core-based statistical area, county and place-level statistics on new privately owned housing units authorized by building or zoning permits.
Permit data can help show:
- where residential development is being authorized;
- whether activity is rising or falling;
- how much proposed construction is single-family or multifamily;
- which states and metro areas have larger potential pipelines;
- where future housing supply may expand.
Permit totals require context. A large state can authorize more units than a small state simply because it has more people and more development overall. Relative measures can tell a different story from raw totals.
Permits also measure housing units authorized, not simply permit documents. One multifamily permit can represent many individual housing units.
Most importantly, authorization does not guarantee immediate construction. Some projects start quickly, some are delayed, and some may never move forward.
The Building Permits Survey covers permit-issuing places. Areas where no building or zoning authorization is required are outside that survey universe, and Census uses imputation or other data sources for some nonreporting activity.
Those coverage and estimation details matter when interpreting permit data.
For a complete state comparison, see Building Permits by State in 2026: All 50 States Ranked.
Readers using permit data for geographic comparisons should also review the Census Bureau’s Building Permits Survey definitions and methodology.
Housing Starts
Housing starts represent a later stage in the development process.
The Census Bureau’s New Residential Construction program provides national and regional estimates for permits, units authorized but not started, starts, units under construction and completions.
These figures cover new privately owned housing units and exclude HUD-code manufactured homes.
Starts can differ from permits for several reasons. Financing conditions may change after a project is authorized.
Developers may delay construction because of labor, material, market or infrastructure constraints. A project can also be redesigned or cancelled.
Comparing permits with starts can therefore help distinguish potential construction from projects that have actually moved into the building phase.
For the latest national and regional construction data, see Housing Starts in 2026, which covers current Census figures for total, single-family and larger-building starts.
Housing Completions
Completions describe housing units that have reached the end of the construction process. They are important because a market does not gain the practical benefit of newly built supply simply because a permit was issued months earlier.
A completion can indicate that previously planned and started housing is finally becoming available for occupancy, but the effect depends on what was built and where.
A wave of apartment completions can affect rental availability differently from a similar number of newly completed detached homes. New units at the upper end of the market may also have a different immediate effect from housing delivered at lower price points.
Completions therefore bring the pipeline closer to actual market availability, but they still need to be interpreted alongside location, housing type, price point and demand.
What Does a Housing Shortage Mean?
Many researchers suggest that the United States has an overall undersupply of homes, but there is no single universally accepted shortage total.
A Congressional Research Service overview notes that estimates and methodologies differ and that local housing markets vary.
A shortage estimate generally compares some measure of available housing with a benchmark for how much housing a market is thought to need.
The benchmark may depend on household formation, population, vacancy, historical relationships, suppressed household formation or other modeling assumptions.
That means two credible analyses can produce different shortage estimates without either calculation necessarily being defective. They may be measuring different things.
A national shortage estimate can also hide large geographic differences. Housing cannot be moved from one metro area to another when local demand shifts.
A region with substantial available housing does not automatically solve a shortage in a fast-growing, supply-constrained market hundreds of miles away.
The most useful way to read shortage claims is therefore to ask:
- What geography is being measured?
- What period does the estimate cover?
- What definition of housing need is being used?
- Does the estimate account for normal vacancy?
- Is it measuring total units, available units or units affordable to a particular group?
- Is it comparing current conditions with a historical or modeled benchmark?
Shortage estimates are most informative when the methodology is clear.
Housing Supply and Demand
Housing conditions are determined by the interaction of supply and demand.
Demand can change because of population growth, household formation, migration, employment, income, mortgage rates, access to credit, age and household composition, and preferences about location and housing type.
Supply responds on a different timetable. Existing homes can come onto the market relatively quickly, but new construction usually takes much longer because land, approvals, financing, infrastructure and construction all precede completion.
When demand grows faster than supply can adjust, buyers and renters may face fewer choices and stronger competition. When supply grows faster than demand, vacancy or inventory can rise and sellers or landlords may face more competition.
But neither side operates in isolation. A market with rapid construction can remain tight if demand is growing just as quickly. A market with weak construction can still experience softer prices if demand falls.
Why More Housing Does Not Immediately Lower Prices or Rents
Additional housing supply can improve market capacity and choice, but the effect is not always immediate or uniform.
Several reasons explain why.
Construction takes time. A project can spend months or years moving from authorization to completion. Today’s permits do not become today’s available homes.
Location matters. New homes help the market where they are built. Construction in one part of a state does not necessarily relieve a shortage in another.
Housing type matters. A market can add many apartments while buyers of detached homes still face limited choices, or vice versa.
Price point matters. Some newly built units may initially target households able to pay for new construction. That does not mean the units have no supply effect, but it does mean the immediate affordability impact can vary across households.
Demand can absorb new supply. Strong job growth, migration or household formation can fill new units quickly enough that vacancy remains tight.
Financing conditions influence both sides of the market. Higher interest rates can constrain development while also affecting buyer purchasing power and homeowner willingness to sell.
For these reasons, “more construction” and “lower prices” should not be treated as a simple one-step relationship.
Single-Family and Multifamily Supply
Housing supply is not one uniform category.
Residential construction can include:
- detached single-family homes;
- attached homes and townhouses;
- duplexes and other small multifamily properties;
- larger apartment buildings;
- condominium projects.
The mix matters because different housing types serve different households, locations and price points.
A state can authorize a large number of total housing units while much of that activity is concentrated in multifamily buildings. Another state can authorize fewer units overall but have a larger share of single-family development.
Total unit counts are therefore useful, but they can conceal important differences in the kind of housing being added.
Housing Supply, Population Growth and Migration
Population growth can increase housing demand, but population alone does not determine how much housing a place needs.
Household formation matters because housing demand is generated by households, not simply by head counts.
Changes in household size, age structure, marriage, divorce, multigenerational living and young adults forming independent households can all affect the relationship between population and housing demand.
Migration also changes where demand is concentrated. Places gaining residents may need more housing even when national population growth is modest. Places losing residents can experience a different balance between existing stock and demand.
Supply response then determines how much of that demand can be accommodated without sharply tightening the market.
Explore U.S. Migration Trends for research on population movement and its relationship to housing and place.
Housing Supply and Rental Vacancy
Rental vacancy provides a different view of housing availability.
A market can be building a large amount of rental housing while still maintaining low vacancy if renter demand is growing at a similar or faster pace.
It can also experience rising vacancy during a period of heavy apartment completions if new units reach the market faster than demand absorbs them.
Vacancy therefore helps answer a different question from construction activity. Construction shows what is being added.
Rental vacancy rates help show the share of the rental inventory that is vacant and available for rent under the relevant survey definition.
For current state-level vacancy research, see Rental Vacancy Rate by State in 2026: All 50 States Ranked.
For metro-level availability, see Rental Vacancy Rates by City in 2026: 75 U.S. Metro Areas Ranked.
Housing Supply and Home Prices
Limited housing supply can contribute to stronger competition for available homes, but supply is only one factor affecting prices.
Home prices can also be influenced by:
- mortgage rates;
- household income;
- employment;
- migration;
- local demand;
- credit conditions;
- land availability;
- construction costs;
- taxes and insurance;
- the mix and age of the existing housing stock.
This is why a high level of new construction does not automatically mean home prices will fall. Strong demand can absorb new supply, and newly built homes may not match the locations, types or price points where shortages are most acute.
Likewise, low construction does not by itself prove that a market is unaffordable. Affordability also depends on incomes, financing costs, taxes, insurance and other household expenses.
Explore U.S. Housing Markets for broader research on prices, inventory and market conditions.
What Can Limit New Housing Supply?
New housing supply can be constrained by a combination of market, physical, financial and regulatory conditions.
Potential constraints include:
- land availability;
- zoning and land-use rules;
- permitting and approval processes;
- infrastructure capacity;
- construction labor;
- material availability and costs;
- overall construction costs;
- development financing;
- interest rates;
- environmental constraints;
- geography and topography;
- local opposition;
- uncertainty about future demand.
The effect of any one constraint varies by place.
Land may be abundant at a regional level but scarce near jobs and transportation. Zoning may allow housing in theory while infrastructure limits practical development.
Financing conditions can make an otherwise permitted project difficult to start. Labor or material costs can affect whether a project remains economically viable.
Constraints also interact. A long approval process becomes more consequential when financing is expensive. High land costs can make development more difficult when allowable density is low. Infrastructure shortages can slow development even where demand is strong.
Development Patterns by Place
Housing development varies substantially across the United States because local markets differ in land, regulation, infrastructure, demand and existing housing stock.
States
State comparisons can show broad differences in permitting, construction and housing-stock growth, but statewide totals can hide major local variation.
A fast-growing metro may account for a large share of a state’s development while rural areas or slower-growing regions follow very different patterns.
For state-level housing research, explore U.S. States.
Metropolitan Areas
Metro areas are often useful for studying housing supply because labor markets, commuting patterns and residential development extend beyond individual city boundaries.
A household may work in one jurisdiction and live in another, so the effective housing market is often larger than the central city.
Explore Cities & Metro Areas for metro-level research.
Cities
Cities within the same metro can have very different development conditions. Land availability, zoning, infrastructure, building types and local demand can vary substantially across municipal boundaries.
One city may permit substantial multifamily construction while a neighboring jurisdiction adds little new housing. Looking only at the metro total can therefore obscure important local differences.
Neighborhoods and Suburbs
Housing development can be even more concentrated at the neighborhood level.
A metro may be adding a substantial number of homes overall while built-out neighborhoods add very little. New subdivisions, redevelopment districts, transit corridors or suburban growth areas can account for a disproportionate share of new units.
Explore Neighborhoods & Suburbs for more localized place research.
Geographic Mismatch: Why National Supply Is Not Local Supply
Housing is fixed in place. That simple fact is central to understanding supply.
A vacant home in one region does not directly satisfy demand in another region where jobs, schools, family ties or other opportunities are concentrated. National totals can therefore coexist with severe local shortages.
The same mismatch can occur within a metro area. New supply may be concentrated far from major employment centers, in a housing type that does not match demand, or at price points that are difficult for many households to reach.
For that reason, national supply measures are useful for broad context, but local and regional analysis is usually necessary to understand actual market pressure.
How We Use Housing Supply Data
Housing-supply analysis can draw from:
- U.S. Census Bureau Building Permits Survey;
- U.S. Census Bureau New Residential Construction;
- federal housing and economic datasets;
- state and local government sources;
- other authoritative housing datasets where appropriate.
Different datasets measure different stages of the housing system, use different geographic boundaries, and can refer to different reporting periods.
A permit series should not be presented as though it were a completions series. A rental-vacancy rate should not be treated as though it directly measures for-sale inventory. A national estimate should not be assumed to describe every metro area.
Data vintage also matters. Construction conditions can change quickly, while housing-stock estimates and survey-based measures may be released on a different schedule.
For those reasons, we aim to identify the geography, time period, definition and source used in each analysis and to keep unlike measures separate.
For broader research standards, see our Editorial Policy.
Research Housing Supply and Development Across the United States
Housing supply is best understood as a system rather than a single statistic.
The existing housing stock shows long-run capacity. Inventory and vacancy help describe current availability. Permits and starts show what may be moving through the pipeline.
Completions show newly delivered units. Population, household formation and migration help explain demand. Local rules, land, infrastructure, costs and financing help determine how quickly supply can respond.
Reading those measures together gives a clearer picture than relying on any one number.
This guide connects our research on building permits, housing starts, housing completions, housing-stock growth, vacancy, supply constraints and development patterns across U.S. states, metros, cities and neighborhoods.