Housing Starts in 2026: Latest U.S. Census Data and Regional Trends
U.S. housing starts were running at a seasonally adjusted annual rate of 1.275 million units in August 2026, according to the latest U.S. Census Bureau and U.S. Department of Housing and Urban Development New Residential Construction release available as of October 6, 2026.
That August point estimate was 2.6% below the revised July rate of 1.309 million and 1.2% below the August 2025 rate of 1.291 million. Those changes should be read cautiously, however.
The Census Bureau’s 90% confidence intervals for both comparisons include zero, which means the data do not provide sufficient statistical evidence to conclude that the actual national change was different from zero.
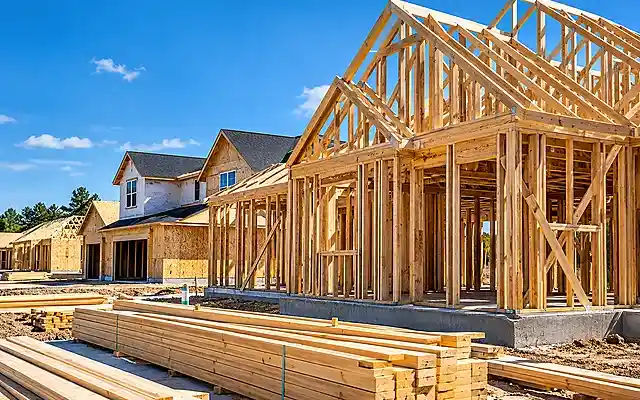
Housing starts measure the beginning of construction, not building authorization and not completed homes. They therefore provide a useful view of where new residential supply has entered physical construction.
The latest release also shows that single-family and larger-building starts were moving differently. Single-family starts were at a 918,000 annualized rate in August, while starts in buildings with five units or more were at 344,000.
Housing Starts in August 2026
The August 2026 release provides three useful national reference points: total housing starts, single-family starts, and starts in buildings with five units or more.
| Measure | August 2026 SAAR | Revised July 2026 | August 2025 | Census point change from July | Census point change from year earlier |
|---|---|---|---|---|---|
| Total housing starts | 1,275,000 | 1,309,000 | 1,291,000 | -2.6% | -1.2% |
| Single-family starts | 918,000 | 853,000 | 873,000 | +7.6% | +5.2% |
| Starts in buildings with 5+ units | 344,000 | 444,000 | 407,000 | -22.5% | -15.5% |
SAAR means seasonally adjusted annual rate. It annualizes the current monthly pace after adjusting for recurring seasonal patterns. It does not mean that 1.275 million homes physically began construction during August itself.
The Census confidence intervals also matter. The 2.6% total decline from July carried a ±12.0% 90% confidence interval.
The 7.6% single-family increase carried a ±14.0% interval, while the 22.5% decline in starts for buildings with five units or more carried a ±24.9% interval. Each of those intervals includes zero.
For that reason, the August point estimates are useful for describing the latest measured level, but they should not be treated as proof of a definitive one-month national trend.
Housing Starts by U.S. Region
The Census Bureau publishes housing-start estimates for four regions: the Northeast, Midwest, South, and West.
| Census region | Total starts, August 2026 SAAR | Single-family starts, August 2026 SAAR | 2026 YTD starts through August (NSA) |
|---|---|---|---|
| Northeast | 96,000 | 46,000 | 94,900 |
| Midwest | 198,000 | 143,000 | 136,100 |
| South | 658,000 | 531,000 | 490,300 |
| West | 323,000 | 198,000 | 203,800 |
The South accounted for the largest raw level of housing starts in August, followed by the West, Midwest, and Northeast. That ordering should not be interpreted as a ranking of which regional housing market is strongest.
The regions differ substantially in population, housing stock, development scale, and market composition.
The monthly movements were also uneven. The Northeast’s total August starts estimate was 44.5% below revised July, with a ±18.5% 90% confidence interval.
That interval does not include zero. By contrast, the Midwest, South, and West month-to-month total-start changes all had confidence intervals that included zero.
The regional figures are therefore most useful as a description of where construction activity was occurring, rather than as a stand-alone scorecard of regional housing-market performance.
For broader context on the stages through which new housing enters the market, see Real Estate Lynx’s Housing Supply & Development guide.
Single-Family and 5+ Unit Starts Tell Different Stories
Housing starts are not one uniform category. Single-family starts were running at a 918,000 SAAR in August 2026.
That was above the revised July point estimate of 853,000 and above the August 2025 point estimate of 873,000, although the Census confidence intervals mean neither comparison should be overstated as a statistically established increase.
Starts in buildings with five units or more were at a 344,000 annualized rate in August. The corresponding July rate was 444,000, and the August 2025 rate was 407,000.
Here again, the wide confidence intervals mean the point-estimate declines should be described cautiously.
The Census also tracks a separate 2-to-4-unit category. In the seasonally adjusted starts table, that series does not meet the publication standards required for identifiable and stable seasonality, so it is not appropriate to treat the 5+ unit series as a complete substitute for every possible definition of multifamily construction.
That distinction matters. A change in 5+ unit starts can say something about larger residential buildings, but it does not by itself summarize every form of multifamily housing activity.
2026 Year-to-Date Housing Starts
Monthly housing-start estimates can move sharply, so the year-to-date data provide another useful perspective.
Through August 2026, the United States had recorded an estimated 925,100 housing starts on a not-seasonally-adjusted basis. That compared with 933,900 starts through the same point in 2025.
| Measure | 2026 through August | 2025 through August | Census YTD change | 90% confidence interval |
|---|---|---|---|---|
| Total starts | 925,100 | 933,900 | -1.0% | ±3.7% |
| Single-family starts | 625,600 | 656,600 | -4.7% | ±3.2% |
| Starts in buildings with 5+ units | 289,900 | 264,100 | +9.7% | ±12.1% |
The total year-to-date change remains statistically uncertain because its confidence interval includes zero.
Single-family starts are different. The Census published a 4.7% year-to-date decline with a ±3.2% confidence interval, which does not include zero.
That provides stronger statistical evidence that single-family starts through August 2026 were below the comparable 2025 period.
For starts in buildings with five units or more, the 9.7% year-to-date point increase came with a ±12.1% confidence interval. Because that range includes zero, it should not be described as a statistically established increase.
This is why monthly and cumulative measures should be kept separate. SAAR is useful for comparing the current monthly pace on a seasonally adjusted basis, while year-to-date counts show the actual estimated number of starts accumulated through the reporting period.
Housing Starts vs. Building Permits
Building permits and housing starts measure different points in the residential construction pipeline. A building permit records authorization from a local jurisdiction.
A housing start is recorded when excavation begins for the footings or foundation. For a building containing multiple housing units, the Census counts all units in the building as started when that excavation begins.
That means a project can be authorized without immediately appearing in housing-start data. Some projects begin quickly, some are delayed, and some may never move forward.
For the state-level authorization side of the pipeline, see our Building Permits by State in 2026 analysis.
Keeping permits and starts separate is important because a high level of authorizations does not automatically mean the same number of housing units has begun construction.
Housing Starts vs. Housing Completions
Housing starts are also different from housing completions. In August 2026, privately owned housing completions were running at a 1.128 million SAAR.
That was below the 1.275 million housing-starts rate for the same month, but the two figures should not be interpreted as a direct one-month flow from starts to completions.
Homes started in one month are generally completed later, and the construction period varies by housing type, project size, location, financing, labor availability, and other factors.
The Census defines a completed house as one in which all finished flooring has been installed, or as completed at occupancy if it is occupied before all construction work is finished.
For privately owned buildings with two or more housing units, the units are counted as completed when at least half are occupied or available for occupancy.
Starts therefore show construction entering the physical building stage. Completions measure a later stage of the supply pipeline.
What Housing Starts Can and Cannot Tell You
Housing starts are an important construction indicator, but they do not answer every housing-market question.
They can help show the current pace at which new privately owned residential construction is beginning, how that pace differs across Census regions, how single-family and larger-building starts are moving, how current construction compares with prior periods, and where starts sit relative to permits and completions in the housing-supply pipeline.
They do not, by themselves, establish that a region has stronger housing demand, better affordability, higher home prices, faster population growth, greater investment attractiveness, or more completed housing coming to market on a fixed timetable.
Those conclusions require additional evidence. For broader economic context around construction, supply, rates, employment, and market conditions, see Housing Economy, Migration & Development.
Why Monthly Housing Starts Can Be Volatile
The Census Bureau specifically cautions against overinterpreting one monthly change in seasonally adjusted construction statistics.
Housing starts are estimated from sample surveys, so the published figures are subject to sampling variability as well as nonsampling error. The release provides confidence intervals to show the uncertainty around percentage changes.
The Bureau also notes that month-to-month movements can be irregular and that it may take about six months to establish an underlying trend for total housing starts.
That warning is especially relevant in August 2026. The headline total point estimate was lower than July, but the confidence interval around the change was wide enough to include both a possible decline and a possible increase.
A careful reading therefore separates three questions: What is the latest published level? What direction does the point estimate show? Is the measured change statistically distinguishable from zero? Those questions do not always produce the same answer.
Methodology
This analysis uses the U.S. Census Bureau and U.S. Department of Housing and Urban Development New Residential Construction release for August 2026, issued September 17, 2026.
As of October 6, 2026, August 2026 is the latest completed monthly release. The September report is scheduled for October 20, 2026.
The article uses seasonally adjusted annual rates for the August national and regional snapshot, not-seasonally-adjusted year-to-date counts for cumulative 2026 comparisons, Census-published percentage changes and 90% confidence intervals, and the standard Census regional geography of the Northeast, Midwest, South, and West.
August 2026 estimates are preliminary where identified by Census, while July estimates are revised where shown.
New Residential Construction covers privately owned residential housing. The statistics exclude publicly owned housing, HUD-code manufactured homes, group quarters, transient accommodations such as hotels and motels, relocated buildings, and housing units created within existing residential or nonresidential structures.
The Census uses the Survey of Construction together with Building Permits Survey information to produce New Residential Construction statistics.
The estimates in the starts tables are sample-based and are subject to sampling and nonsampling error.
This article does not rank states by housing starts. The New Residential Construction series used here supports the national and regional scope of this analysis, while more geographically detailed building-permit data are handled separately.
Frequently Asked Questions
What are housing starts?
Housing starts measure the beginning of construction on new privately owned residential housing units. A start occurs when excavation begins for the footings or foundation. For a multifamily building, all housing units in the building are counted as started when that excavation begins.
What is the latest U.S. housing starts rate in 2026?
As of October 6, 2026, the latest Census release covers August 2026. Total privately owned housing starts were at a seasonally adjusted annual rate of 1.275 million.
Did U.S. housing starts fall in August 2026?
The August point estimate was 2.6% below the revised July estimate. However, the Census reported a ±12.0% 90% confidence interval, which includes zero. The data therefore do not provide sufficient statistical evidence to conclude that the actual month-to-month change was different from zero.
What does SAAR mean in housing-start data?
SAAR stands for seasonally adjusted annual rate. It adjusts for normal seasonal patterns and expresses the current monthly pace as an annualized rate. It is not the actual number of housing units that began construction during that month.
Which U.S. region had the most housing starts in August 2026?
The South had the largest raw regional total, at a 658,000 SAAR. The West followed at 323,000, the Midwest at 198,000, and the Northeast at 96,000. Those totals are not adjusted for regional population or housing-stock size, so they should not be used as a simple ranking of housing-market strength.
Are housing starts the same as building permits?
No. A building permit records authorization to proceed with construction, while a housing start records the point when construction begins under the Census definition.
Are housing starts the same as completed homes?
No. Housing starts record the beginning of construction. Housing completions measure a later stage when construction has reached the Census definition of completion.
Do housing starts predict home prices?
Not by themselves. Housing starts provide information about new residential construction activity, but home prices are influenced by many other factors, including existing inventory, demand, mortgage rates, income, employment, land constraints, and local market conditions.
Housing Starts Show Where New Supply Has Entered Construction
The August 2026 Census data put the national housing-starts pace at 1.275 million SAAR, with single-family starts at 918,000 and starts in buildings with five units or more at 344,000.
The larger lesson is not simply whether one monthly point estimate moved up or down. Housing starts are most useful when they are read as one stage in a longer supply pipeline and when monthly changes are interpreted alongside confidence intervals, year-to-date data, housing type, and regional context.
Through August, total 2026 starts were close to the comparable 2025 level, while single-family year-to-date starts were measurably lower under the Census confidence-interval framework. Regionally, the South recorded the largest raw level of starts, but the figures should not be treated as normalized measures of market strength.
Used carefully, housing starts help show where planned housing has entered physical construction without implying more than the data can support.
Sources
- U.S. Census Bureau and HUD: New Residential Construction, August 2026
- U.S. Census Bureau: New Residential Construction Historical Releases
- U.S. Census Bureau: Survey of Construction Definitions
- U.S. Census Bureau: New Residential Construction Methodology
- U.S. Census Bureau: Housing Starts Economic Indicator