Housing Starts in 2026: Latest U.S. Census Data and Regional Trends
See the latest U.S. housing starts data for 2026, including single-family and multifamily construction, regional trends, and what the latest Census figures show.

Explore the economic forces shaping U.S. housing, including interest rates, employment, construction, supply, demand, household finances, and broader market conditions.
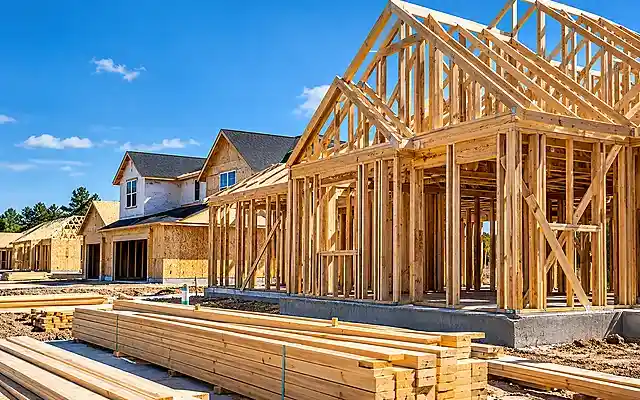
See the latest U.S. housing starts data for 2026, including single-family and multifamily construction, regional trends, and what the latest Census figures show.
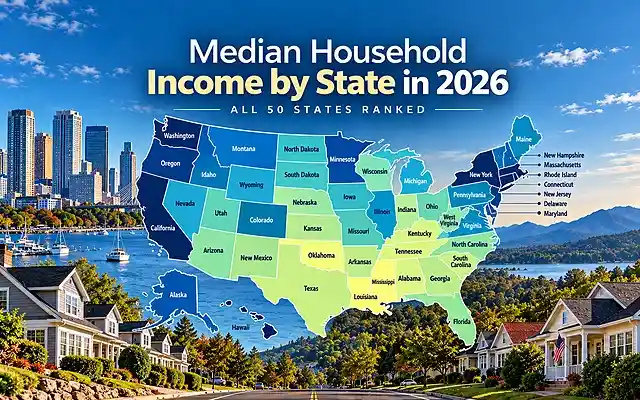
Compare median household income across all 50 states using the latest verified 2024 Census ACS figures, including rankings, margins of error, and the national median.
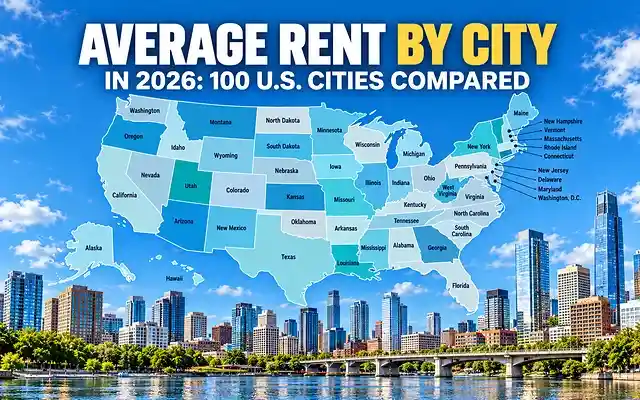
Compare average one-bedroom rent across 100 large U.S. cities using a September 2026 Apartments.com rental-market snapshot. See the highest and lowest rents and the complete city-by-city ranking.
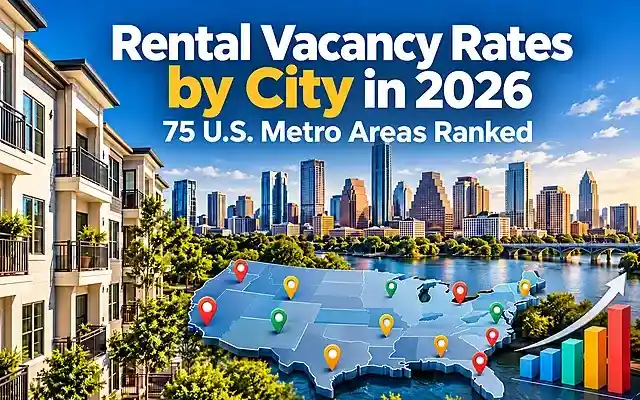
Rental vacancy rates vary significantly across U.S. metro areas. This 2026 ranking compares vacancy rates across 75 major markets and shows where rental supply is tightest and where vacancies are highest.
Idaho led the housing growth by state ranking from July 2024 to July 2025, with its…
Compare 2025 Census rental vacancy rates across all 50 states, from Louisiana at 11.1% to Maine at 2.2%, with the 7.1% U.S. benchmark and 2026 national context.
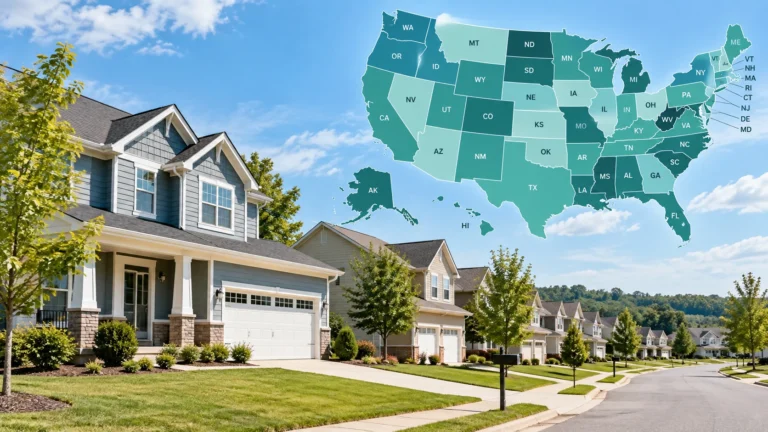
Compare the homeownership rate by state across all 50 states using the latest annual Census data, including the highest and lowest homeownership rates.

See the fastest-growing U.S. cities in 2026 using the latest Census population estimates, including percentage growth and the cities adding the most residents.

Learn how the mortgage rate lock-in effect is influencing homeowner mobility, housing inventory and home sales in 2026 as many owners hold low-rate mortgages.
End of content
End of content