Average Rent by City in 2026: 100 U.S. Cities Compared
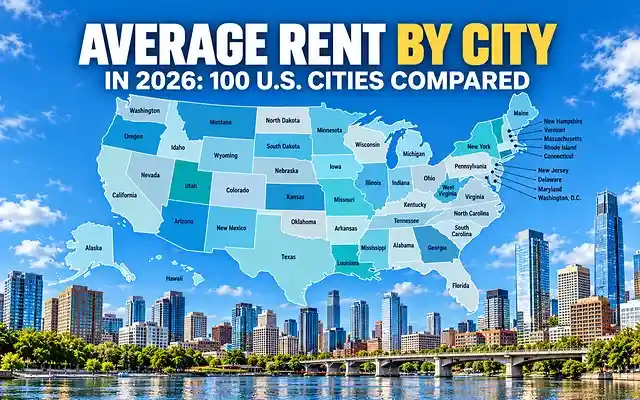
Average rent by city varies widely across major U.S. cities in 2026. This comparison uses a defined universe of 100 large U.S. cities and a consistent September 2026 Apartments.com rent measure to show how average monthly one-bedroom rent differs from city to city.
The ranking is a city-level comparison, not a ranking of metropolitan areas or every municipality in the United States. The population universe is based on the U.S. Census Bureau’s Vintage 2025 city population estimates, while the rent observations come from Apartments.com rental-market trend pages. Apartments.com identifies CoStar Group Market Trend reports as the source of its rent data.
Average Rent by City in 2026
The Apartments.com U.S. benchmark is $1,665 per month for average one-bedroom rent in its September 2026 national rental-market snapshot. Within this 100-city dataset, the simple arithmetic mean of the city-level rents is $1,552, and the median is $1,391. 24 cities are above the $1,665 national benchmark, 75 are below it, and 1 is exactly at the benchmark.
These statistics describe the selected 100-city dataset. The simple mean is not a population-weighted national rent estimate.
100-City Ranking
The table ranks the 100 cities from highest to lowest average one-bedroom rent. Where two or more cities have the same rent figure, ties are ordered by 2025 Census population, with the more populous city listed first.
| Rent Rank | City | State / District | 2025 Population | Average One-Bedroom Rent |
|---|---|---|---|---|
| 1 | New York | NY | 8,584,629 | $4,196/month |
| 2 | San Francisco | CA | 826,079 | $3,631/month |
| 3 | Boston | MA | 672,973 | $3,581/month |
| 4 | Jersey City | NJ | 302,013 | $3,318/month |
| 5 | Irvine | CA | 318,764 | $3,044/month |
| 6 | San Jose | CA | 989,814 | $2,868/month |
| 7 | San Diego | CA | 1,406,106 | $2,448/month |
| 8 | Washington | DC | 693,645 | $2,305/month |
| 9 | Oakland | CA | 440,838 | $2,263/month |
| 10 | Miami | FL | 489,812 | $2,254/month |
| 11 | Santa Ana | CA | 315,586 | $2,240/month |
| 12 | Los Angeles | CA | 3,869,089 | $2,199/month |
| 13 | Chula Vista | CA | 275,533 | $2,171/month |
| 14 | Anaheim | CA | 341,008 | $2,133/month |
| 15 | Seattle | WA | 784,777 | $2,128/month |
| 16 | Chicago | IL | 2,731,585 | $2,058/month |
| 17 | Riverside | CA | 323,057 | $1,909/month |
| 18 | Long Beach | CA | 450,469 | $1,892/month |
| 19 | Scottsdale | AZ | 243,006 | $1,845/month |
| 20 | St. Petersburg | FL | 264,033 | $1,832/month |
| 21 | Philadelphia | PA | 1,574,281 | $1,777/month |
| 22 | Chesapeake | VA | 255,332 | $1,761/month |
| 23 | Port St. Lucie | FL | 268,062 | $1,752/month |
| 24 | Nashville | TN | 721,074 | $1,682/month |
| 25 | Virginia Beach | VA | 453,737 | $1,665/month |
| 26 | Newark | NJ | 323,808 | $1,661/month |
| 27 | Atlanta | GA | 529,110 | $1,652/month |
| 28 | Tampa | FL | 413,554 | $1,647/month |
| 29 | Denver | CO | 740,613 | $1,618/month |
| 30 | Orlando | FL | 333,888 | $1,585/month |
| 31 | Gilbert | AZ | 287,285 | $1,580/month |
| 32 | Sacramento | CA | 536,449 | $1,573/month |
| 33 | Boise City | ID | 238,429 | $1,569/month |
| 34 | Baltimore | MD | 569,997 | $1,536/month |
| 35 | Portland | OR | 635,109 | $1,530/month |
| 36 | Reno | NV | 283,621 | $1,524/month |
| 37 | Chandler | AZ | 278,748 | $1,518/month |
| 38 | Madison | WI | 286,233 | $1,504/month |
| 39 | Charlotte | NC | 964,784 | $1,474/month |
| 40 | Henderson | NV | 353,289 | $1,474/month |
| 41 | Frisco | TX | 236,955 | $1,474/month |
| 42 | Cape Coral | FL | 236,264 | $1,457/month |
| 43 | Plano | TX | 293,028 | $1,456/month |
| 44 | Pittsburgh | PA | 307,632 | $1,438/month |
| 45 | Richmond | VA | 237,257 | $1,436/month |
| 46 | Austin | TX | 1,002,632 | $1,421/month |
| 47 | Minneapolis | MN | 430,324 | $1,411/month |
| 48 | Dallas | TX | 1,329,491 | $1,408/month |
| 49 | Norfolk | VA | 231,013 | $1,404/month |
| 50 | Durham | NC | 305,561 | $1,397/month |
| 51 | Raleigh | NC | 506,306 | $1,385/month |
| 52 | Cleveland | OH | 363,608 | $1,377/month |
| 53 | Aurora | CO | 410,053 | $1,370/month |
| 54 | Anchorage | AK | 287,155 | $1,370/month |
| 55 | McKinney | TX | 236,001 | $1,353/month |
| 56 | Irving | TX | 257,076 | $1,331/month |
| 57 | North Las Vegas | NV | 296,653 | $1,318/month |
| 58 | Colorado Springs | CO | 494,743 | $1,315/month |
| 59 | Jacksonville | FL | 1,017,689 | $1,313/month |
| 60 | Fresno | CA | 555,549 | $1,305/month |
| 61 | Bakersfield | CA | 422,165 | $1,305/month |
| 62 | Phoenix | AZ | 1,665,481 | $1,300/month |
| 63 | Stockton | CA | 324,597 | $1,295/month |
| 64 | St. Paul | MN | 306,684 | $1,291/month |
| 65 | Mesa | AZ | 513,656 | $1,280/month |
| 66 | New Orleans | LA | 362,154 | $1,279/month |
| 67 | Fort Worth | TX | 1,028,117 | $1,272/month |
| 68 | Kansas City | MO | 521,220 | $1,255/month |
| 69 | Las Vegas | NV | 679,817 | $1,253/month |
| 70 | Buffalo | NY | 274,613 | $1,247/month |
| 71 | Garland | TX | 249,625 | $1,230/month |
| 72 | Milwaukee | WI | 562,407 | $1,224/month |
| 73 | Albuquerque | NM | 556,588 | $1,181/month |
| 74 | Glendale | AZ | 260,572 | $1,181/month |
| 75 | Columbus | OH | 938,396 | $1,179/month |
| 76 | Houston | TX | 2,397,315 | $1,177/month |
| 77 | Greensboro | NC | 308,667 | $1,160/month |
| 78 | St. Louis | MO | 278,144 | $1,151/month |
| 79 | Cincinnati | OH | 314,367 | $1,149/month |
| 80 | Arlington | TX | 402,134 | $1,133/month |
| 81 | Winston-Salem | NC | 257,271 | $1,128/month |
| 82 | Indianapolis | IN | 901,116 | $1,127/month |
| 83 | Louisville | KY | 641,962 | $1,127/month |
| 84 | Detroit | MI | 649,095 | $1,120/month |
| 85 | Lexington | KY | 329,751 | $1,114/month |
| 86 | Omaha | NE | 488,797 | $1,103/month |
| 87 | Lincoln | NE | 301,522 | $1,088/month |
| 88 | Huntsville | AL | 233,627 | $1,075/month |
| 89 | San Antonio | TX | 1,548,422 | $1,061/month |
| 90 | Fort Wayne | IN | 275,203 | $1,045/month |
| 91 | Memphis | TN | 609,647 | $1,042/month |
| 92 | Laredo | TX | 269,515 | $1,028/month |
| 93 | Corpus Christi | TX | 317,247 | $1,012/month |
| 94 | El Paso | TX | 683,012 | $1,003/month |
| 95 | Tucson | AZ | 548,371 | $993/month |
| 96 | Oklahoma City | OK | 719,849 | $942/month |
| 97 | Tulsa | OK | 416,209 | $924/month |
| 98 | Lubbock | TX | 273,071 | $860/month |
| 99 | Wichita | KS | 400,987 | $846/month |
| 100 | Toledo | OH | 263,423 | $835/month |
Cities With the Highest Average Rent
Within this defined 100-city universe, the highest average one-bedroom rents are concentrated in several high-cost coastal and major urban markets.
- New York, NY: $4,196/month
- San Francisco, CA: $3,631/month
- Boston, MA: $3,581/month
- Jersey City, NJ: $3,318/month
- Irvine, CA: $3,044/month
- San Jose, CA: $2,868/month
- San Diego, CA: $2,448/month
- Washington, DC: $2,305/month
- Oakland, CA: $2,263/month
- Miami, FL: $2,254/month
New York has the highest rent in the dataset at $4,196 per month, followed by San Francisco at $3,631 and Boston at $3,581.
The highest and lowest values are descriptive of this specific city universe. They are not an overall affordability ranking.
Cities With the Lowest Average Rent
The lowest average one-bedroom rents in the dataset are found across a mix of Southern, Southwestern, Great Plains, and Midwestern cities.
- Memphis, TN: $1,042/month
- Laredo, TX: $1,028/month
- Corpus Christi, TX: $1,012/month
- El Paso, TX: $1,003/month
- Tucson, AZ: $993/month
- Oklahoma City, OK: $942/month
- Tulsa, OK: $924/month
- Lubbock, TX: $860/month
- Wichita, KS: $846/month
- Toledo, OH: $835/month
Toledo has the lowest figure in the 100-city dataset at $835 per month, followed by Wichita at $846 and Lubbock at $860.
A lower rent figure does not by itself establish that a city is more affordable overall because this comparison does not account for household income or other living costs.
How the 100-City Ranking Was Built
The city universe is based on the U.S. Census Bureau’s Vintage 2025 population estimates. The Census Bureau publishes annual population estimates for U.S. cities and towns, including a ranked 2025 population table. See the Census Bureau city and town population estimates.
For rent, the ranking uses Apartments.com’s September 2026 rental-market pages. Apartments.com reports a national average one-bedroom rent of $1,665 for September 2026 and identifies CoStar Group Market Trend reports as the source of its rent data. See Apartments.com’s U.S. rental-market trends.
The primary metric is average monthly one-bedroom apartment rent. On the city pages used for this comparison, Apartments.com’s headline Average Rent corresponds to the one-bedroom figure.
The research dataset was frozen to the September 2026 source values used for this article. Apartments.com updates its market-trend data, so live source pages can change after the research snapshot is frozen.
The geographic unit is the city, not the metropolitan statistical area. A metro-wide rent measure covers a broader geography and is outside this ranking.
What “Average Rent” Means in This Ranking
Average rent in this article refers specifically to the Apartments.com city-level rent measure used in the September 2026 research snapshot and represented by the one-bedroom average.
Different rental statistics are not interchangeable. Median gross rent from the Census Bureau, HUD Fair Market Rent, Zillow’s Observed Rent Index, two-bedroom asking rent, and other rental measures use different definitions, datasets or geographic universes.
For background on those alternative measures, see Zillow Research data, the Census ACS B25064 table, and HUD USER Fair Market Rents.
This article therefore uses one primary source family and one primary unit type throughout the ranking instead of combining incompatible measures.
Why Rent Figures Can Differ by Source
Different rental sources can report different numbers without necessarily contradicting one another. The property universe, unit mix, geography, statistical measure and update period can all differ.
Zillow’s ZORI, for example, is a different rental-market measure from an Apartments.com one-bedroom average. Census median gross rent is also a different statistic, while HUD Fair Market Rent is a programmatic benchmark with its own methodology.
Those figures can be useful for other research questions, but they should not be substituted for the metric used in this table.
How to Use This Ranking
Use the table to compare city-level rent levels and to identify where rental prices are relatively higher or lower within this defined 100-city universe.
Do not treat the ranking as a complete affordability score. Household income, taxes, transportation, utilities, insurance and other costs can materially change the overall cost of living.
For a state-level comparison, see Average Rent by State in 2026. For city-level rental vacancy, see Rental Vacancy Rates by City in 2026.
Frequently Asked Questions
What U.S. city has the highest average rent?
New York has the highest average one-bedroom rent in this 100-city dataset at $4,196 per month in the September 2026 Apartments.com research snapshot.
What city has the cheapest rent?
Toledo has the lowest average one-bedroom rent in this defined 100-city universe at $835 per month.
What is the average rent in the U.S. in 2026?
Apartments.com reports a national average one-bedroom rent of $1,665 per month in its September 2026 U.S. rental-market snapshot.
Why is this not a ranking of the most affordable cities?
Because rent is only one component of household affordability. This article ranks one-bedroom rent within a defined city universe and does not combine rent with income, taxes, transportation or other living costs.
Is city rent the same as metro-area rent?
No. A city-level figure applies to the named city, while a metropolitan-area figure covers a broader housing and labor market that can include multiple cities and surrounding communities.
Why does the average rent differ from other websites?
Different sources use different datasets, property types, geographic areas and statistical methods. This article uses the September 2026 Apartments.com/CoStar city-level one-bedroom measure consistently across the ranking.