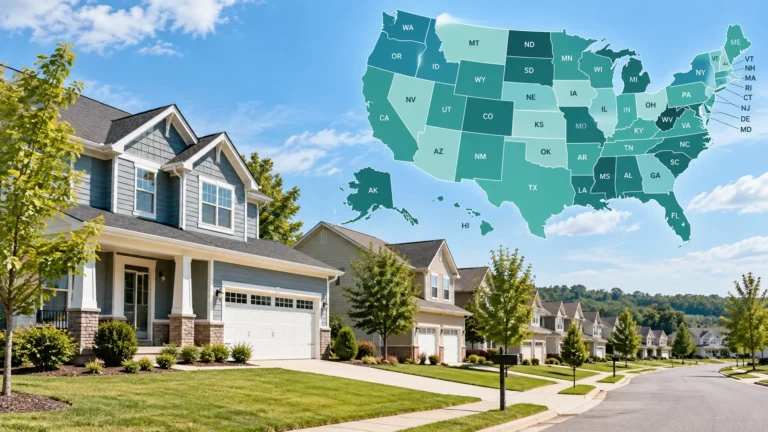
Rental Vacancy Rate by State in 2026: All 50 States Ranked
The rental vacancy rate by state varies widely across the country. According to the U.S. Census Bureau’s Housing Vacancies and Homeownership: Annual Statistics 2025, Louisiana had the highest 2025 rental vacancy point estimate among the 50 states at 11.1%, while Maine had the lowest at 2.2%. The U.S. annual rental vacancy rate was 7.1% in 2025.
This article is current for 2026, but the state ranking intentionally uses 2025 annual estimates. That is the latest completed annual Census dataset that places all 50 states on one consistent time basis. A newer 7.3% U.S. rental vacancy rate for Q2 2026 is included later as national context, but it is not mixed into the 2025 state ranking.
Rental Vacancy Rate by State: 2025 Census Ranking
The table below ranks the 50 states using the Census Bureau’s Table 3: Rental Vacancy Rates by State. The final column compares each state with the 7.1% U.S. annual benchmark and shows the difference in percentage points.
| Rank | State | 2025 rental vacancy rate | Difference vs. U.S. average |
|---|---|---|---|
| 1 | Louisiana | 11.1% | +4.0 pp |
| 2 | Texas | 11.0% | +3.9 pp |
| 3 | Florida | 10.2% | +3.1 pp |
| 4 | Arkansas | 10.1% | +3.0 pp |
| 5 | South Carolina | 9.8% | +2.7 pp |
| 6 | Alabama | 9.5% | +2.4 pp |
| 7 | Missouri | 9.4% | +2.3 pp |
| 8 | Indiana | 8.9% | +1.8 pp |
| 8 | West Virginia | 8.9% | +1.8 pp |
| 10 | Hawaii | 8.7% | +1.6 pp |
| 10 | Tennessee | 8.7% | +1.6 pp |
| 12 | Arizona | 8.4% | +1.3 pp |
| 13 | Michigan | 8.0% | +0.9 pp |
| 14 | Iowa | 7.9% | +0.8 pp |
| 15 | Oklahoma | 7.7% | +0.6 pp |
| 16 | Mississippi | 7.6% | +0.5 pp |
| 16 | Oregon | 7.6% | +0.5 pp |
| 16 | Utah | 7.6% | +0.5 pp |
| 19 | North Dakota | 7.3% | +0.2 pp |
| 20 | Wisconsin | 7.1% | 0.0 pp |
| 20 | Wyoming | 7.1% | 0.0 pp |
| 22 | South Dakota | 6.7% | -0.4 pp |
| 23 | Georgia | 6.6% | -0.5 pp |
| 23 | Kentucky | 6.6% | -0.5 pp |
| 23 | New Mexico | 6.6% | -0.5 pp |
| 23 | Pennsylvania | 6.6% | -0.5 pp |
| 23 | Washington | 6.6% | -0.5 pp |
| 28 | Nevada | 6.5% | -0.6 pp |
| 29 | Kansas | 6.4% | -0.7 pp |
| 29 | North Carolina | 6.4% | -0.7 pp |
| 31 | Idaho | 6.2% | -0.9 pp |
| 32 | Virginia | 6.0% | -1.1 pp |
| 33 | Montana | 5.9% | -1.2 pp |
| 33 | Nebraska | 5.9% | -1.2 pp |
| 33 | Ohio | 5.9% | -1.2 pp |
| 36 | Colorado | 5.8% | -1.3 pp |
| 37 | Illinois | 5.7% | -1.4 pp |
| 37 | Maryland | 5.7% | -1.4 pp |
| 39 | Delaware | 5.6% | -1.5 pp |
| 40 | Alaska | 5.3% | -1.8 pp |
| 40 | New York | 5.3% | -1.8 pp |
| 42 | Minnesota | 5.1% | -2.0 pp |
| 43 | New Jersey | 4.9% | -2.2 pp |
| 44 | California | 4.8% | -2.3 pp |
| 45 | Connecticut | 4.7% | -2.4 pp |
| 46 | Rhode Island | 4.0% | -3.1 pp |
| 47 | New Hampshire | 3.9% | -3.2 pp |
| 48 | Massachusetts | 3.4% | -3.7 pp |
| 49 | Vermont | 3.0% | -4.1 pp |
| 50 | Maine | 2.2% | -4.9 pp |
Washington, D.C.: The Census reported a 2025 rental vacancy rate of 7.9% for the District of Columbia. D.C. is retained in the source data but excluded from this ranking because the table covers the 50 states.
Ties are preserved, so some rank numbers are skipped. The ranking should also be read as a comparison of point estimates, not as proof that every adjacent state has a statistically different underlying vacancy rate. The Census publishes a separate Table B-3 with margins of error for state vacancy and homeownership rates.
How to Read the Ranking
Three features of the 2025 table stand out.
First, the gap between the highest and lowest point estimates was 8.9 percentage points: 11.1% in Louisiana versus 2.2% in Maine.
Second, 19 states were above the 7.1% U.S. annual rate, two matched it, and 29 were below it. Wisconsin and Wyoming were the two states exactly at the national annual rate.
Third, many neighboring ranks are separated by only a few tenths of a percentage point. Because these are survey estimates with published margins of error, a small difference in rank is not automatically a statistically meaningful difference.
At the high end: Louisiana, Texas and several Southern states
Louisiana’s 11.1% point estimate ranked first, just 0.1 percentage point above Texas at 11.0%. Florida followed at 10.2%, Arkansas at 10.1%, and South Carolina at 9.8%.
Those five states were all at least 2.7 percentage points above the national annual rate. But the table does not establish a single cause for those higher readings. A higher vacancy rate can occur when new rental supply arrives faster than renters absorb it, when renter demand softens, when turnover is elevated, or when several local market conditions overlap.
The 0.1-point gap between Louisiana and Texas is also a good example of why rank order needs context. Without a statistical test using the relevant uncertainty estimates, it would be too strong to claim that Louisiana’s underlying vacancy rate was definitively higher than Texas’s.
At the low end: Maine and the Northeast
Maine’s 2.2% point estimate was the lowest among the states. Vermont followed at 3.0%, Massachusetts at 3.4%, New Hampshire at 3.9%, and Rhode Island at 4.0%.
A low vacancy rate can be consistent with a tighter rental market, but it should not be translated into a simple “good” or “bad” label. Low availability can make a housing search more difficult for renters, while property owners may view the same condition as evidence of stronger tenant demand. The actual effect still depends on rents, new construction, household growth, local incomes and the property segment being considered.
For price context, compare this ranking with Real Estate Lynx’s Average Rent by State in 2026. Vacancy measures available rental inventory; rent measures price. The two answer different questions.
What Does the Rental Vacancy Rate Actually Measure?
The Census Bureau defines the rental vacancy rate as the proportion of the rental inventory that is vacant for rent.
In simplified form:
Rental vacancy rate = vacant units for rent ÷ rental inventory × 100
The denominator is not every housing unit in a state. It is the rental inventory used for the measure. That distinction matters because a home can be vacant for many reasons and still not count as a unit that is currently available for rent.
For example, imagine a rental inventory of 100 units. If six are vacant and available for rent, the rental vacancy rate would be 6%.
This is also why a Census rental vacancy rate should not be treated as an apartment-only statistic. The CPS/HVS rental inventory is broader than a private dataset that may track only professionally managed multifamily properties.
What Pushes Rental Vacancy Up or Down?
A rental vacancy rate reflects the balance between available supply and renter demand. Either side can change, and a statewide estimate combines many local markets.
New supply can create temporary slack
When a large number of rental homes or apartments are completed, some units can remain unoccupied while leasing catches up. Vacancy can rise during that absorption period even if population and employment are still growing.
The reverse can happen when construction is limited. If renter demand remains firm while few new units become available, the share of rental inventory sitting vacant can stay comparatively low.
Renter demand can move faster than the housing stock
Migration, job growth or job losses, household formation, college enrollment, retirement patterns and other demographic changes can alter the number of households looking to rent.
Those forces do not operate in isolation. A state can gain renters and add a large amount of new supply at the same time. Whether vacancy rises or falls depends on the balance between the two.
A statewide average hides local differences
A single state rate blends large metropolitan areas, smaller cities, suburbs and rural markets. It also combines different kinds of rental housing.
That means two states with the same statewide vacancy rate can have very different local conditions. A statewide figure is best used for broad comparison rather than as a substitute for city-, neighborhood- or property-level analysis.
For a more localized comparison, see Rental Vacancy Rates by City in 2026: 75 U.S. Metro Areas Ranked, which uses Q2 2026 Census estimates to compare rental vacancy across the 75 largest U.S. metropolitan areas.
High Vacancy Is Not Automatically Bad, and Low Vacancy Is Not Automatically Good
Vacancy is useful because it describes how much of the rental inventory is available for rent. It does not, by itself, tell you whether a market is healthy, affordable or attractive for a particular investment.
For renters, higher vacancy can sometimes mean more choice and less competition for available units. Lower vacancy can mean a tighter search environment.
For landlords and property owners, persistent high vacancy can mean more competition for tenants. But a statewide rate cannot tell an owner what will happen at a specific building, in a specific neighborhood or at a particular rent level.
For developers, a higher vacancy rate may reflect new units that are still being absorbed. That is different from a market where vacancy is high because demand has weakened.
Most importantly, a high vacancy rate does not automatically mean rents will fall. Rent direction also depends on asking rents, concessions, new deliveries, renter incomes, lease renewals, local employment and the amount of competing inventory.
There is no universally “good” rental vacancy rate. The useful question is what the rate says when combined with other market indicators, including:
- current rent levels and rent growth;
- housing construction and completions;
- population and household growth;
- employment conditions;
- the local mix of rental property types; and
- the balance between renting and owning.
For tenure context, see the Homeownership Rate by State ranking. For a different affordability lens, the Rent vs. Buy by State comparison looks at home values relative to rents.
Rental Vacancy Is Not the Same as Every Other Vacancy Measure
Several housing statistics use the word “vacancy,” but they are not interchangeable.
Rental vacancy rate measures the share of the rental inventory that is vacant and available for rent.
Homeowner vacancy rate is a separate Census measure for the homeowner inventory that is vacant and available for sale.
Gross vacancy rate uses a broader housing-vacancy concept and should not be substituted for the rental vacancy rate.
Rental occupancy rate describes the occupied side of a rental inventory. In a dataset where the inventory definitions align exactly, occupancy and vacancy move in opposite directions. Commercial data providers can use different property universes, however, so definitions should be compared before treating two published figures as direct complements.
Apartment vacancy rate is often a private-market measure. Depending on the provider, it may cover a narrower set of professionally managed or multifamily properties. The Census rental vacancy rate is not limited to apartments.
This distinction is especially important when comparing state rankings from different sources. Two reports can both use the word “vacancy” and still measure different housing inventories.
U.S. Rental Vacancy Rate in 2026
In its Second Quarter 2026 Housing Vacancies and Homeownership release, the Census Bureau reported a 7.3% national rental vacancy rate. The agency reported that the Q2 2026 rate was essentially unchanged from Q1 2026, which was also 7.3%, and was not statistically different from the 7.0% rate in Q2 2025.
That newer figure answers a different timing question from the state table:
- 7.1% is the 2025 annual U.S. benchmark used with the 2025 annual state estimates.
- 7.3% is the Q2 2026 national rate, included only as current national context.
Keeping those figures separate avoids a mixed-period ranking in which 2025 state estimates are treated as though they were measured during the same period as a 2026 quarterly national estimate.
Methodology: Why This 2026 Article Uses 2025 State Data
This ranking uses the U.S. Census Bureau’s Housing Vacancies and Homeownership Annual Statistics 2025, including Table 3: Rental Vacancy Rates by State, the Census 2025 state rental-vacancy CSV, and Table B-3 for state margins of error.
The process is straightforward:
- Use one completed annual Census dataset for all 50 states.
- Rank the published 2025 rental vacancy point estimates from highest to lowest.
- Preserve identical published values as ties.
- Exclude Washington, D.C., from the 50-state ranking while retaining it as source context.
- Subtract the 7.1% U.S. annual rate from each state estimate to calculate the percentage-point difference shown in the table.
For example, Louisiana’s 11.1% estimate is 4.0 percentage points above the 7.1% U.S. rate. Maine’s 2.2% estimate is 4.9 percentage points below it.
Sampling error matters more than the rank number
The CPS/HVS is a sample survey, so its estimates are subject to sampling and nonsampling error. In the Census Bureau’s Source and Accuracy of Estimates, the agency explains that the published margins of error primarily describe sampling variability and that its statistical comparisons use 90% confidence intervals.
For this ranking, the published point estimates determine the order, but the article does not claim that every rank-to-rank difference is statistically significant. Small gaps should be interpreted with particular care and checked against the corresponding margins of error.
The 2025 annual estimates have an extra limitation
The same Census Source and Accuracy documentation notes that CPS/HVS did not collect data in October 2025 because of a lapse in federal funding. The 2025 annual estimates therefore use 11 months of data rather than all 12, and the Census specifically directs users to note the higher level of uncertainty for the annual 2025 estimates.
The agency also began phasing in a new CPS/HVS sample in April 2025, with the transition scheduled for completion in July 2026.
Those details do not make the state estimates unusable. They do mean the rates should be treated for what they are: survey estimates with documented uncertainty, not exact counts.
Frequently Asked Questions
Which state has the highest rental vacancy rate?
Louisiana had the highest 2025 rental vacancy point estimate among the 50 states at 11.1%. Texas was next at 11.0%. The 0.1-percentage-point gap should not be treated as proof of a statistically significant difference without considering the Census margins of error.
Which state has the lowest rental vacancy rate?
Maine had the lowest 2025 point estimate at 2.2%. Vermont was next at 3.0%, followed by Massachusetts at 3.4%.
What was the U.S. rental vacancy rate in 2025?
The annual U.S. rental vacancy rate was 7.1% in 2025. That is the benchmark used for the state comparisons in this article.
What is the U.S. rental vacancy rate in 2026?
The Census Bureau reported a 7.3% national rental vacancy rate for Q2 2026. It is newer national context and is not substituted into the 2025 annual state table.
Does a high rental vacancy rate mean rents will go down?
Not necessarily. Higher vacancy can increase competition for tenants, but rent changes depend on supply, demand, concessions, incomes, property type, location and other conditions. Vacancy is one input, not a rent forecast.
Is a low vacancy rate better for landlords?
Not automatically. A low rate can indicate tighter rental availability, but investment performance also depends on acquisition cost, achievable rent, operating expenses, financing, taxes, insurance, property condition and local demand. State vacancy data provide broad market context, not an investment recommendation.
Is rental vacancy the same as apartment vacancy?
No. Census rental vacancy covers the rental inventory defined by CPS/HVS. A private apartment-vacancy series may cover a narrower property universe and use a different methodology.
Why are some rank numbers missing?
Ties use standard competition ranking. Indiana and West Virginia, for example, both have a 2025 estimate of 8.9% and share rank 8, so the next state is rank 10.
Use Vacancy and Rent Together
The 2025 state estimates span from 11.1% in Louisiana to 2.2% in Maine, with a 7.1% U.S. annual rate in between. That range is useful for seeing where rental availability was relatively high or low on a statewide basis, but vacancy is only one dimension of a rental market.
The next useful comparison is price. Continue with Average Rent by State in 2026: All 50 States Ranked to compare how much renters are paying with how much rental inventory is sitting vacant.
Sources
- U.S. Census Bureau: Housing Vacancies and Homeownership, Annual Statistics 2025
- U.S. Census Bureau: Table 3, Rental Vacancy Rates by State
- U.S. Census Bureau: 2025 State Rental Vacancy CSV
- U.S. Census Bureau: Table B-3, Margins of Error for Vacancy and Homeownership Rates by State
- U.S. Census Bureau: Source and Accuracy of Estimates
- U.S. Census Bureau: Housing Vacancies and Homeownership Definitions
- U.S. Census Bureau: Second Quarter 2026 Housing Vacancies and Homeownership