Homeownership Rate by State in 2026: All 50 States Ranked
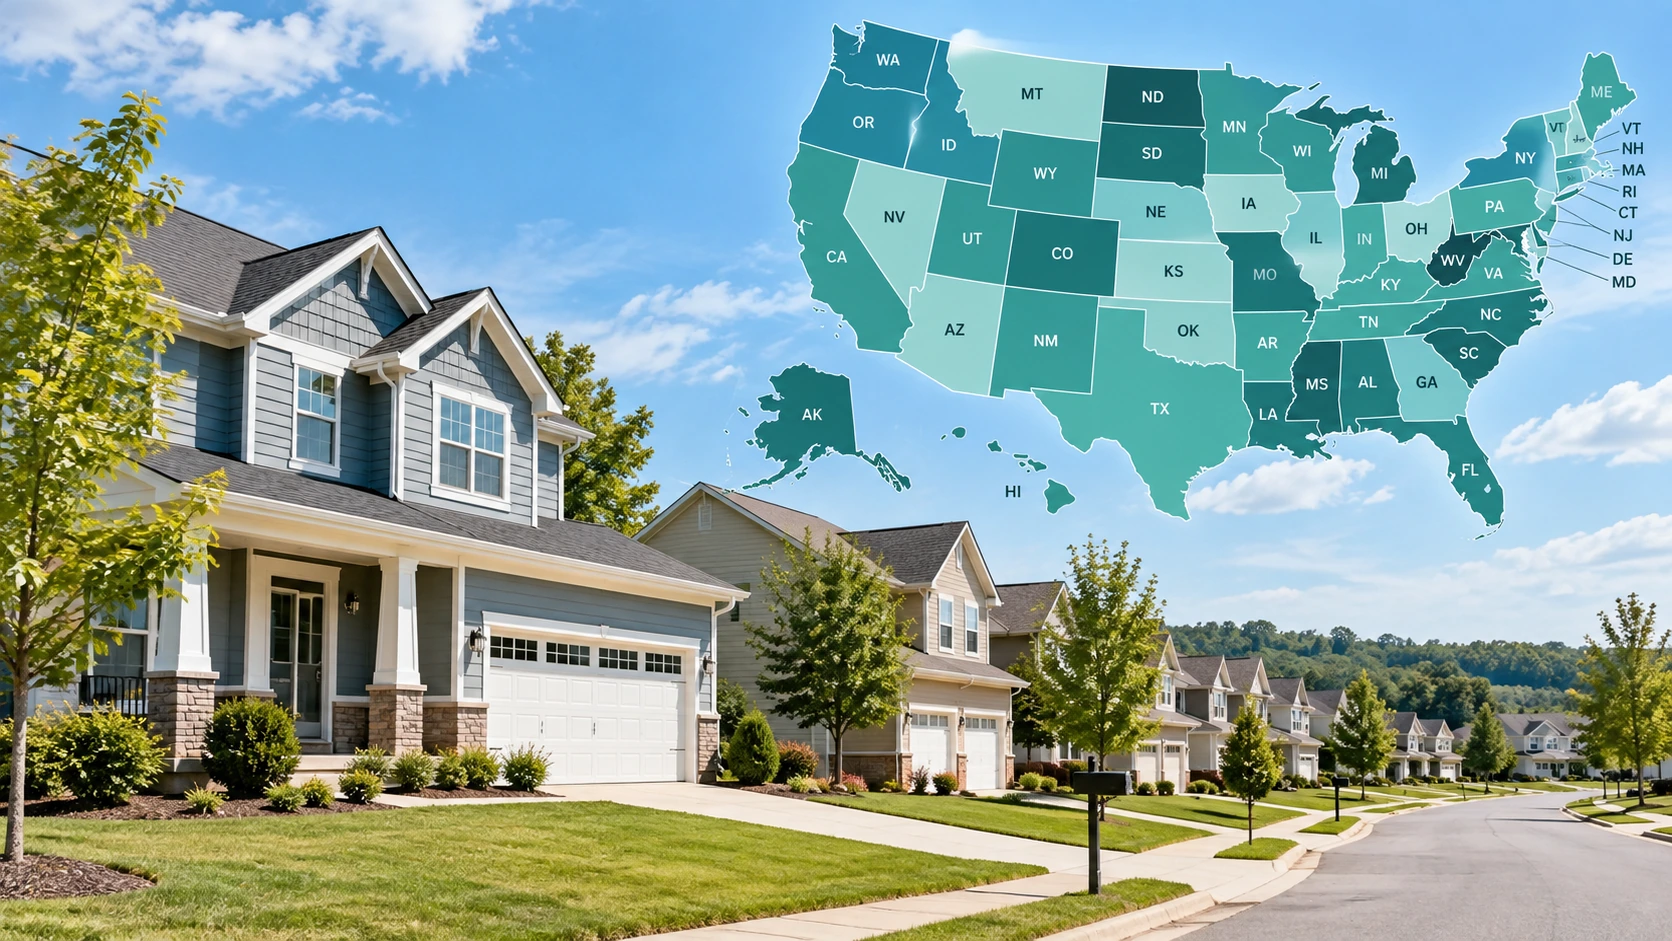
The homeownership rate by state varies sharply across the United States. In the latest completed annual Census ranking available in 2026, West Virginia has the highest homeownership rate at 78.1%, while New York has the lowest among the 50 states at 52.2%.
The U.S. annual homeownership rate was 65.2% in 2025. That means the gap between the highest- and lowest-ranking states was 25.9 percentage points.
This article uses the U.S. Census Bureau’s 2025 annual Housing Vacancies and Homeownership data for the state ranking. The year in the title refers to the latest nationwide comparison available in 2026; it does not mean the state figures were measured across calendar year 2026.
What the Homeownership Rate Measures
The homeownership rate is the share of households that own the home they occupy.
The Census Bureau defines a home as owner-occupied when the owner or co-owner lives in the unit. A home can still count as owner-occupied if it has a mortgage. Condominiums and cooperative units also count as owner-occupied when the owner lives there.
That makes the homeownership rate different from the share of homes owned free and clear, the percentage of residents who personally own a home, or the share of the total housing stock that is owner-occupied.
For example, a state with a 70% homeownership rate has roughly 70 owner households for every 100 occupied households under the Census measure. Vacant homes are not part of the denominator.
Homeownership Rate by State in 2026
| Rank | State | 2025 Homeownership Rate | Difference vs. U.S. Average |
|---|---|---|---|
| 1 | West Virginia | 78.1% | +12.9 pp |
| 2 | Delaware | 75.5% | +10.3 pp |
| 3 | Vermont | 75.3% | +10.1 pp |
| 4 | Mississippi | 74.9% | +9.7 pp |
| 5 | Maine | 74.7% | +9.5 pp |
| 6 | Michigan | 74.0% | +8.8 pp |
| 7 | Wyoming | 73.7% | +8.5 pp |
| 8 | New Hampshire | 73.3% | +8.1 pp |
| 9 | South Carolina | 73.0% | +7.8 pp |
| 10 | Kentucky | 72.4% | +7.2 pp |
| 11 | Indiana | 71.4% | +6.2 pp |
| 12 | Alabama | 71.3% | +6.1 pp |
| 13 | Minnesota | 71.2% | +6.0 pp |
| 14 | New Mexico | 71.0% | +5.8 pp |
| 15 | Montana | 70.7% | +5.5 pp |
| 16 | Ohio | 70.3% | +5.1 pp |
| 17 | Iowa | 70.2% | +5.0 pp |
| 18 | Pennsylvania | 70.1% | +4.9 pp |
| 19 | Arizona | 69.7% | +4.5 pp |
| 20 | Virginia | 69.6% | +4.4 pp |
| 21 | Tennessee | 69.5% | +4.3 pp |
| 22 | Louisiana | 69.3% | +4.1 pp |
| 23 | Arkansas | 68.9% | +3.7 pp |
| 24 | Maryland | 68.8% | +3.6 pp |
| 25 | Idaho | 68.3% | +3.1 pp |
| 25 | Missouri | 68.3% | +3.1 pp |
| 25 | Utah | 68.3% | +3.1 pp |
| 28 | South Dakota | 68.1% | +2.9 pp |
| 29 | Wisconsin | 67.7% | +2.5 pp |
| 30 | Kansas | 67.5% | +2.3 pp |
| 31 | Nebraska | 67.2% | +2.0 pp |
| 32 | Connecticut | 66.6% | +1.4 pp |
| 33 | Illinois | 66.3% | +1.1 pp |
| 34 | Florida | 66.2% | +1.0 pp |
| 35 | Alaska | 65.3% | +0.1 pp |
| 36 | Rhode Island | 65.1% | -0.1 pp |
| 37 | North Dakota | 64.9% | -0.3 pp |
| 38 | North Carolina | 64.5% | -0.7 pp |
| 39 | Oregon | 64.1% | -1.1 pp |
| 40 | Georgia | 63.9% | -1.3 pp |
| 41 | Oklahoma | 63.8% | -1.4 pp |
| 42 | New Jersey | 63.7% | -1.5 pp |
| 43 | Texas | 63.6% | -1.6 pp |
| 44 | Washington | 63.4% | -1.8 pp |
| 45 | Colorado | 62.9% | -2.3 pp |
| 46 | Massachusetts | 62.4% | -2.8 pp |
| 47 | Hawaii | 60.9% | -4.3 pp |
| 48 | Nevada | 59.1% | -6.1 pp |
| 49 | California | 55.3% | -9.9 pp |
| 50 | New York | 52.2% | -13.0 pp |
Source: U.S. Census Bureau, Table 15: Homeownership Rates by State, Annual Statistics 2025. Washington, D.C. is excluded because this article ranks the 50 states.
The difference column compares each state’s 2025 homeownership rate with the 65.2% U.S. annual rate. “pp” means percentage points.
The middle of the ranking sits close to the national benchmark. Alaska, at 65.3%, is 0.1 percentage point above the U.S. rate. Rhode Island, at 65.1%, is 0.1 point below it.
States With the Highest Homeownership Rates
West Virginia has the highest homeownership rate in the 2025 Census state table at 78.1%. The 10 highest-rate states are:
- West Virginia: 78.1%
- Delaware: 75.5%
- Vermont: 75.3%
- Mississippi: 74.9%
- Maine: 74.7%
- Michigan: 74.0%
- Wyoming: 73.7%
- New Hampshire: 73.3%
- South Carolina: 73.0%
- Kentucky: 72.4%
West Virginia’s rate is 12.9 percentage points above the national annual rate. Delaware, Vermont, Mississippi, and Maine are all at or above 74.7%.
There is no single explanation for why these states rank highly. Statewide homeownership reflects the mix of household ages, housing costs, housing types, settlement patterns, incomes, migration, and other economic and demographic conditions.
One useful comparison is home price. West Virginia also has the lowest typical home value in our Average Home Price by State ranking. But price alone does not determine ownership: states with similar home values can still have different homeownership rates because their household and housing-market structures differ.
States With the Lowest Homeownership Rates
New York has the lowest homeownership rate among the 50 states at 52.2%. The 10 lowest-rate states are:
- New York: 52.2%
- California: 55.3%
- Nevada: 59.1%
- Hawaii: 60.9%
- Massachusetts: 62.4%
- Colorado: 62.9%
- Washington: 63.4%
- Texas: 63.6%
- New Jersey: 63.7%
- Oklahoma: 63.8%
New York’s rate is 13.0 percentage points below the U.S. annual benchmark. California is 9.9 points below it.
Several states near the bottom also have relatively expensive housing markets. California, Hawaii, Massachusetts, Washington, New Jersey, Colorado, and New York all rank toward the higher end of our state home-value comparison.
That relationship is useful context, but it should not be treated as proof that expensive housing alone causes a lower homeownership rate. State averages also reflect the mix of large cities, rental housing, age groups, migration patterns, household structures, and local market conditions.
Why Homeownership Rates Differ by State
A homeownership rate is an outcome of many overlapping housing and household characteristics. It is not a standalone score of whether a housing market is healthy or affordable.
Several factors can influence the state-level pattern.
Home Prices and Household Income
The cost of buying a home affects the barrier to ownership, but price should be considered alongside income.
A state with expensive homes can remain more attainable for some households if incomes are also high. A lower-priced state can still be difficult for buyers if local incomes are weak or financing costs are burdensome.
Our Home Price-to-Income Ratio by State analysis looks directly at the relationship between housing values and household income.
Age Structure
Homeownership varies strongly by age nationally. Census data for the first quarter of 2026 show a much lower ownership rate among householders under 35 than among older households, with ownership rising substantially across older age groups.
That does not mean age alone explains the state ranking. It does mean states with different age profiles can produce different homeownership patterns even before considering prices, incomes, or housing supply.
Housing Stock and Urbanization
States differ in the kinds of homes available. Some have a larger share of detached single-family housing and smaller communities, while others contain large metropolitan areas with extensive apartment and rental markets.
A state with a large renter-oriented urban housing stock may therefore have a lower statewide ownership rate even if many suburban or rural areas within the state have high ownership.
Migration and Household Formation
Population movement can also change the mix of owners and renters. Young adults, recent movers, students, and workers relocating for employment are often more likely to rent before buying. Retirement migration can create a different tenure pattern.
These effects vary by place and over time, which is another reason the statewide percentage should be treated as a broad indicator rather than a description of every local market.
Mortgage and Financing Conditions
Mortgage rates, down-payment requirements, credit conditions, taxes, insurance, and other ownership costs influence the transition from renting to buying.
Those conditions can affect states differently because home prices, property taxes, insurance costs, and household incomes vary widely.
Our Housing Affordability hub examines these broader ownership pressures.
High Homeownership Rate Does Not Automatically Mean Housing Is Affordable
Homeownership and affordability are related, but they are not interchangeable. The homeownership rate tells us what share of occupied households own their homes. It does not tell us:
- how expensive homes are;
- how much owners paid when they bought;
- whether current buyers can qualify for a mortgage;
- how large down payments need to be;
- what owners pay in property taxes or insurance;
- whether existing owners are financially stretched; or
- whether renters can realistically become homeowners today.
A state can have a high ownership rate partly because many households bought years ago under very different price and mortgage conditions.
Likewise, a lower ownership rate does not automatically mean a state is a poor place to own. Some states have large urban rental markets, high population mobility, or housing patterns where renting is more common.
For a current-buyer perspective, compare this ranking with our Rent vs. Buy by State analysis and our broader affordability research.
Homeownership and Home Prices Do Not Move in Lockstep
The 2025 ranking illustrates why homeownership should be evaluated separately from raw home prices.
West Virginia ranks first for homeownership at 78.1% and also has the lowest typical home value in our June 2026 home-value ranking.
But Delaware ranks second for homeownership even though its typical home value is considerably higher than West Virginia’s. New Hampshire ranks eighth for ownership while also sitting among the more expensive states by home value.
On the other side, New York and California combine high home values with low ownership rates, but Texas also falls in the bottom 10 for homeownership despite having a much lower typical statewide home value than those two states.
The point is not that home prices do not matter. It is that ownership reflects the interaction of prices with incomes, financing, demographics, housing stock, and household preferences.
How the 2025 State Ranking Relates to the 2026 National Rate
The latest completed annual state table is for 2025, but the Census Bureau also publishes newer quarterly national data.
In the second quarter of 2026, the U.S. homeownership rate was 65.0% on a not seasonally adjusted basis. The Census Bureau reported that this was virtually the same as the second quarter of 2025 and not statistically different from the first quarter of 2026.
That quarterly national figure should not be substituted into the state table.
The state ranking above uses one consistent annual dataset for all 50 states, while the Q2 2026 figure is included only to show the most recent national context available at publication time.
Why Small Differences Between States Should Be Treated Cautiously
The Census homeownership figures are survey estimates, not exact counts of every household.
The Census Bureau’s 2025 annual HVS release includes margins of error for state homeownership estimates. That means a small difference between two states may not represent a meaningful statistical difference.
This is especially important around ties and near-ties.
Idaho, Missouri, and Utah, for example, all have a reported 2025 homeownership rate of 68.3% and share rank 25 in the source ranking. The next state, South Dakota, is at 68.1%.
For that reason, this table is best used to understand broad state-level patterns rather than to overinterpret differences of a few tenths of a percentage point.
Methodology
This ranking uses Table 15, Homeownership Rates by State, from the U.S. Census Bureau’s Housing Vacancies and Homeownership: Annual Statistics 2025.
The Census Bureau’s Housing Vacancies and Homeownership program is based on the Current Population Survey/Housing Vacancy Survey.
The homeownership rate is the proportion of occupied households that are owner-occupied. An owner-occupied unit includes a home where the owner or co-owner lives, including homes with mortgages and owner-occupied condominium or cooperative units.
States are ordered according to the source’s 2025 ranking. Ties are preserved. Idaho, Missouri, and Utah therefore share rank 25, and the next rank is 28.
Washington, D.C. appears in the underlying state-and-district data at 40.3%, but it is excluded from this article because the ranking covers the 50 states.
The U.S. annual homeownership rate was 65.2% in 2025. The percentage-point comparison in our table subtracts that national figure from each state’s rate.
The Census Bureau also reports a Q2 2026 U.S. homeownership rate of 65.0% on a not seasonally adjusted basis. That newer quarterly figure is kept separate and is not mixed into the 2025 annual state ranking.
Housing survey estimates are subject to sampling error. Readers should avoid treating very small differences between states as precise measures of relative performance.
Questions About Homeownership Rate by State
Which state has the highest homeownership rate?
West Virginia has the highest 2025 homeownership rate among the 50 states at 78.1%, according to the U.S. Census Bureau’s annual Housing Vacancies and Homeownership data.
Which state has the lowest homeownership rate?
New York has the lowest 2025 homeownership rate among the 50 states at 52.2%. Washington, D.C. is lower at 40.3%, but it is not a state and is excluded from the 50-state ranking.
What is the U.S. homeownership rate?
The annual U.S. homeownership rate was 65.2% in 2025. The Census Bureau’s newer Q2 2026 estimate was 65.0% on a not seasonally adjusted basis.
What does a 70% homeownership rate mean?
A 70% homeownership rate means roughly 70% of occupied households are owner-occupied under the Census definition. It does not mean 70% of individual residents own a home.
Does a high homeownership rate mean a state is affordable?
Not necessarily. A high ownership rate can reflect demographics, historical buying conditions, housing stock, household composition, and other factors. Current affordability also depends on home prices, incomes, mortgage rates, taxes, insurance, and other ownership costs.
Why is the article called a 2026 ranking if the state data are from 2025?
The 2025 annual Census table is the latest completed nationwide state homeownership dataset available in 2026. The title reflects the current comparison year, while the methodology clearly identifies the underlying data vintage.
Homeownership Is One Part of the Housing Economy
The difference between West Virginia’s 78.1% homeownership rate and New York’s 52.2% rate is substantial, but the percentage should not be read as a complete judgment on either housing market.
Homeownership rates reflect who occupies the housing stock and whether those households own or rent. They do not directly measure current purchase affordability, home values, housing supply, or the financial condition of homeowners.
Use this ranking to understand the broad ownership pattern across the states, then compare it with prices and incomes for a clearer view of buyer affordability.
For broader context on the economic forces shaping ownership, prices, supply, demand, and financing, explore our Housing Economy research.
For the next step, see our Home Price-to-Income Ratio by State analysis to compare housing values with household income across all 50 states.