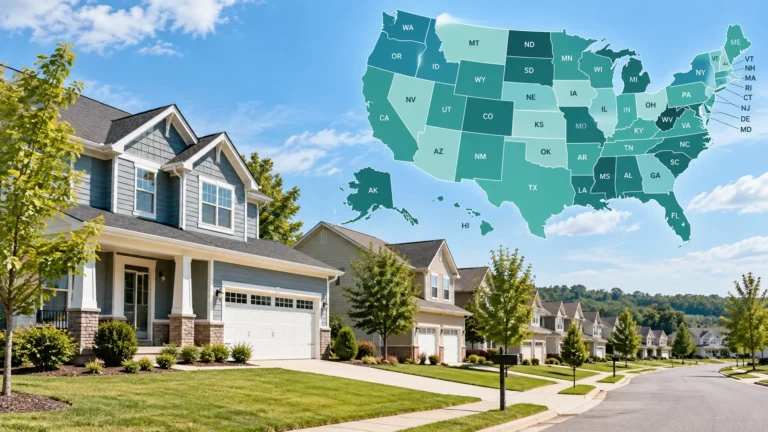
Housing Growth by State in 2026: All 50 States Ranked

Idaho led the housing growth by state ranking from July 2024 to July 2025, with its estimated housing stock increasing about 2.1%. Arizona ranked second at 2.0%, followed by South Carolina at 1.9%. Texas ranked sixth by growth rate, but it added more housing units than any other state, with an estimated increase of 224,805 units.
Nationally, the estimated housing stock increased from 146,829,273 units on July 1, 2024 to 148,260,882 on July 1, 2025. That is a net increase of 1,431,609 housing units, or about 1.0%.
This 2026 comparison uses the U.S. Census Bureau’s Vintage 2025 Population and Housing Unit Estimates, the most recent completed and consistent housing-unit vintage currently available. The ranking measures change in the estimated housing-unit stock. It does not rank states by building permits, housing starts, completions, listings, population growth, or home prices.
Housing Growth by State: 2025 Census Ranking
The table below ranks all 50 states by the Census Bureau’s percentage change in estimated housing units from July 1, 2024 to July 1, 2025.
| Rank | State | 2025 housing units | Units added | Growth rate |
|---|---|---|---|---|
| 1 | Idaho | 849,155 | +17,385 | 2.1% |
| 2 | Arizona | 3,373,746 | +66,141 | 2.0% |
| 3 | South Carolina | 2,579,744 | +47,524 | 1.9% |
| 4 | Utah | 1,307,088 | +23,649 | 1.8% |
| 5 | North Carolina | 5,168,052 | +91,320 | 1.8% |
| 6 | Texas | 12,848,245 | +224,805 | 1.8% |
| 7 | Florida | 10,789,047 | +161,242 | 1.5% |
| 8 | Nevada | 1,384,956 | +19,691 | 1.4% |
| 9 | Tennessee | 3,291,207 | +46,407 | 1.4% |
| 10 | Georgia | 4,734,436 | +64,947 | 1.4% |
| 11 | Delaware | 483,447 | +6,535 | 1.4% |
| 12 | South Dakota | 429,698 | +5,749 | 1.4% |
| 13 | Colorado | 2,706,544 | +31,681 | 1.2% |
| 14 | Washington | 3,436,929 | +39,404 | 1.2% |
| 15 | Nebraska | 891,309 | +9,469 | 1.1% |
| 16 | Montana | 544,280 | +5,223 | 1.0% |
| 17 | Arkansas | 1,435,645 | +13,445 | 0.9% |
| 18 | Alabama | 2,406,306 | +22,516 | 0.9% |
| 19 | New Mexico | 981,652 | +8,352 | 0.9% |
| 20 | Maine | 771,492 | +6,206 | 0.8% |
| 21 | Indiana | 3,052,602 | +24,494 | 0.8% |
| 22 | Kentucky | 2,070,495 | +16,532 | 0.8% |
| 23 | Wyoming | 283,790 | +2,249 | 0.8% |
| 24 | Virginia | 3,779,544 | +28,874 | 0.8% |
| 25 | California | 14,995,410 | +113,440 | 0.8% |
| 26 | Oregon | 1,909,216 | +14,360 | 0.8% |
| 27 | Wisconsin | 2,840,960 | +20,726 | 0.7% |
| 28 | Vermont | 346,310 | +2,519 | 0.7% |
| 29 | New York | 8,738,856 | +63,152 | 0.7% |
| 30 | Iowa | 1,469,096 | +10,605 | 0.7% |
| 31 | Oklahoma | 1,816,244 | +12,907 | 0.7% |
| 32 | New Hampshire | 662,160 | +4,695 | 0.7% |
| 33 | Mississippi | 1,369,536 | +9,587 | 0.7% |
| 34 | Louisiana | 2,156,598 | +15,084 | 0.7% |
| 35 | Minnesota | 2,616,906 | +18,283 | 0.7% |
| 36 | Hawaii | 574,520 | +3,509 | 0.6% |
| 37 | Kansas | 1,319,219 | +7,558 | 0.6% |
| 38 | North Dakota | 385,687 | +2,204 | 0.6% |
| 39 | Missouri | 2,876,341 | +16,045 | 0.6% |
| 40 | Maryland | 2,613,933 | +13,548 | 0.5% |
| 41 | Ohio | 5,367,824 | +26,075 | 0.5% |
| 42 | Michigan | 4,694,141 | +22,535 | 0.5% |
| 43 | Massachusetts | 3,072,289 | +13,557 | 0.4% |
| 44 | West Virginia | 871,879 | +3,597 | 0.4% |
| 45 | Pennsylvania | 5,882,221 | +21,759 | 0.4% |
| 46 | Connecticut | 1,558,206 | +4,988 | 0.3% |
| 47 | Rhode Island | 489,077 | +1,401 | 0.3% |
| 48 | Illinois | 5,504,295 | +14,843 | 0.3% |
| 49 | Alaska | 331,217 | +865 | 0.3% |
| 50 | New Jersey | 3,827,726 | +9,016 | 0.2% |
How to read the table: Washington, D.C., is included in the Census source but excluded from the 50-state ranking. D.C. had 371,606 estimated housing units in 2025, up 911 units, with a displayed growth rate of 0.2%.
The Census workbook displays growth rates rounded to one decimal place. States with the same displayed percentage can therefore appear at different positions because the source ordering reflects more precise underlying values.
The underlying state files are available through the Census Bureau’s National, State, and County Housing Unit Totals: 2020-2025 page.
Which States Had the Fastest Housing Growth?
The six highest-ranked states by percentage growth were Idaho, Arizona, South Carolina, Utah, North Carolina, and Texas.
Idaho’s estimated housing stock increased from 831,770 units to 849,155, a gain of 17,385 units and about 2.1%. Arizona added 66,141 units and grew about 2.0%. South Carolina added 47,524 units and grew about 1.9%.
Utah, North Carolina, and Texas all display 1.8% growth in the published Census table. They do not share the same position because those percentages are rounded. Among the 50 states, the Census source ordering places Utah fourth, North Carolina fifth, and Texas sixth based on more precise underlying values.
At the other end of the ranking, New Jersey placed 50th, with displayed growth of about 0.2%. Alaska, Illinois, Rhode Island, and Connecticut also had relatively small percentage increases.
A lower percentage does not necessarily mean little housing was added. New Jersey’s estimated housing stock still increased by 9,016 units. The percentage ranking should therefore be read as a rate-of-change comparison, not a simple count of new units.
Which States Added the Most Housing Units?
When states are compared by the number of housing units added instead of percentage growth, the order changes substantially.
| Numeric rank | State | Units added | Percent-growth rank |
|---|---|---|---|
| 1 | Texas | +224,805 | 6 |
| 2 | Florida | +161,242 | 7 |
| 3 | California | +113,440 | 25 |
| 4 | North Carolina | +91,320 | 5 |
| 5 | Arizona | +66,141 | 2 |
| 6 | Georgia | +64,947 | 10 |
| 7 | New York | +63,152 | 29 |
| 8 | South Carolina | +47,524 | 3 |
| 9 | Tennessee | +46,407 | 9 |
| 10 | Washington | +39,404 | 14 |
Texas and Florida together accounted for approximately 27.0% of the national housing-unit increase. The five states adding the most units accounted for about 45.9%, and the top ten accounted for approximately 64.2%.
Those shares describe where the estimated housing stock increased most in absolute terms. They do not show whether the added supply was sufficient relative to population, household formation, vacancies, prices, or local demand.
For broader geographic context, our U.S. States coverage brings together state-level housing, affordability, migration, and economic research.
Why Percentage Growth and Units Added Can Point to Different States
The difference comes down to the denominator.
A state with a relatively small existing housing stock can post a high growth rate after adding a modest number of units. A much larger state can add far more housing units but still post a lower percentage increase because the additional units are measured against a much larger base.
Idaho, Texas, and California illustrate the contrast:
- Idaho ranked first by percentage growth at about 2.1%, but added 17,385 housing units.
- Texas ranked sixth by percentage growth at about 1.8%, but added 224,805 units, the largest numerical increase.
- California ranked 25th by percentage growth at about 0.8%, yet added 113,440 units, the third-largest numerical increase.
Both measures are useful, but they answer different questions. The percentage ranking is better for comparing the pace of housing-stock expansion across differently sized states. The numeric ranking is better for identifying where the largest absolute additions to the national housing stock occurred.
Using the rounded growth rates displayed in the Census source table, the median state was about 0.8%. That provides a useful benchmark for reading a top-ranked rate such as Idaho’s 2.1%.
What Does “Housing Growth” Mean in This Ranking?
Here, housing growth means the net change in the Census Bureau’s estimated housing-unit stock between two July 1 reference dates.
The Census defines a housing unit as a house, apartment, mobile home or trailer, group of rooms, or single room occupied, or intended for occupancy, as separate living quarters. Both occupied and vacant housing units can be part of the housing inventory.
The Population Estimates Program does not estimate housing stock by simply counting one construction measure. Census uses a components-of-change approach. Starting from the housing-unit base, it adds estimated new residential construction and new mobile homes, then subtracts estimated housing-unit losses.
That matters because a state’s net housing-stock change can differ from the number of homes permitted, started, or completed during the same period. Demolitions and other housing-unit losses reduce the stock, while mobile-home additions are also part of the estimate.
Census explains the definition of a housing unit in its Housing Unit Estimates glossary and describes the estimation process in its Population and Housing Unit Estimates methodology.
Housing Growth Is Not the Same as Building Permits
This distinction deserves special attention because the two national numbers for 2025 are almost identical.
The Population Estimates Program shows a net increase of 1,431,609 housing units from July 1, 2024 to July 1, 2025.
Separately, the Census Bureau’s 2025 annual Building Permits data report 1,431,616 new privately owned housing units authorized by permits during calendar year 2025.
The totals differ by only seven units, but they are not the same statistic.
The periods differ. One compares housing-stock estimates between two July 1 reference dates, while the permit total covers the 2025 calendar year.
The concepts also differ. Building permits measure authorized new privately owned residential units. Housing-unit estimates measure the net size of the housing stock after accounting for components that add to or subtract from that stock.
A permitted unit may not start or finish construction during the same period. Housing-unit losses can reduce net stock growth. For those reasons, the near match between the two national totals should never be interpreted as evidence that permits and housing-stock growth are equivalent.
For the authorization measure, see our Building Permits by State in 2026. For a wider explanation of the supply pipeline, see Housing Supply & Development.
What This Ranking Can and Cannot Tell You
Housing-stock growth is useful for showing where the estimated supply base expanded fastest, but it does not explain a housing market by itself.
A higher growth rate does not automatically mean that a state is more affordable, building enough housing for demand, attracting more residents, or producing better housing outcomes.
Several factors change how the ranking should be interpreted.
State size matters. A smaller state can rank high by percentage while contributing relatively few units to the national increase.
Population and housing are different measures. Housing units can grow faster or slower than population. Vacancy, household size, seasonal housing, and migration can all affect the relationship.
Net stock change is not a completion count. The estimate reflects additions and losses rather than one construction-stage statistic.
Affordability requires separate evidence. Prices, rents, incomes, financing costs, housing type, and local demand all matter.
A high rank is not inherently better. Whether housing growth is sufficient or insufficient depends on conditions outside this ranking.
For broader market indicators, U.S. Housing Markets covers supply alongside prices, inventory, demand, sales activity, and other housing conditions.
Why Does a 2026 Article Use 2025 Housing Data?
The Census Bureau releases Population Estimates Program data in annual vintages.
Vintage 2025 is the most recent completed and consistent housing-unit estimate series currently available. It includes national, state, and county housing-unit estimates through July 1, 2025.
Census also revises the post-2020 time series with each new vintage. Its Population and Housing Unit Estimates dataset guidance states that newer products supersede older vintages and that data from separate vintages should not be combined.
That is why this 2026 article uses one internally consistent Vintage 2025 dataset rather than mixing figures from different releases.
All values in the 50-state ranking therefore use the same source vintage and the same July 1, 2024 to July 1, 2025 comparison period.
Methodology
This ranking uses the U.S. Census Bureau Population Division workbook NST-EST2025-HU-ANNCHG, Estimates of Housing Unit Change for the United States, States, District of Columbia, and State Rankings: July 1, 2024 to July 1, 2025.
The workbook was released in May 2026 as part of the Vintage 2025 housing-unit estimates. Census’s Vintage 2025 housing-unit release was made public on May 14, 2026.
States are ranked according to the source’s percentage change in estimated housing units from July 1, 2024 to July 1, 2025. The number of units added is reported as a secondary measure.
Washington, D.C., remains in the underlying source data but is excluded from the 50-state ranking.
The 50 states plus D.C. reconcile exactly to the national totals:
- July 1, 2024: 146,829,273 housing units
- July 1, 2025: 148,260,882 housing units
- Net increase: 1,431,609 housing units
- Published national growth: 1.0%
The Census table rounds state growth rates to one decimal place. This article preserves the source ordering among the 50 states, excludes Washington, D.C., and then numbers the states from 1 through 50 rather than attempting to reorder apparent ties from the rounded percentages.
Because Census revises the full time series with each annual vintage, this analysis uses Vintage 2025 consistently and does not combine it with earlier vintages.
Frequently Asked Questions
Which state had the fastest housing growth?
Idaho ranked first, with its estimated housing-unit stock increasing about 2.1% from July 1, 2024 to July 1, 2025. Arizona ranked second at 2.0%, followed by South Carolina at 1.9%.
Which state added the most housing units?
Texas added the most estimated housing units, with a net increase of 224,805. Florida ranked second by numeric increase at 161,242, followed by California at 113,440.
Which state had the slowest housing growth?
New Jersey ranked 50th among the states, with a displayed housing-stock growth rate of about 0.2%. Its estimated housing stock still increased by 9,016 units.
What does housing growth mean?
In this ranking, housing growth is the net change in the Census Bureau’s estimated housing-unit stock between July 1, 2024 and July 1, 2025.
Is housing growth the same as new homes built?
No. Net housing-stock change reflects components that add to and subtract from the estimated housing inventory. It is not a direct count of newly completed homes.
Is housing growth the same as building permits?
No. Building permits measure new privately owned housing units authorized through building or zoning permits. This ranking measures net change in the estimated housing-unit stock.
Why can states with the same displayed growth rate have different ranks?
The Census workbook rounds state growth rates to one decimal place. The official ranking reflects more precise underlying values, so states displaying the same rounded rate can still have different positions.
Why does a 2026 ranking use 2025 estimates?
Vintage 2025 is the most recent completed and consistent Census housing-unit estimate series currently available. It provides the latest comparable annual state housing-unit estimates.
Does faster housing growth mean housing is more affordable?
No. Housing-stock growth is only one part of housing-market conditions. Affordability also depends on prices, rents, incomes, financing costs, local demand, location, and the types of housing available.
Housing Growth Shows How the Supply Base Is Changing
The state rankings reveal two distinct patterns. Idaho, Arizona, and South Carolina led by percentage growth, while Texas, Florida, and California led by units added. Reading only one measure would hide that difference.
Housing-stock estimates also answer a broader question than building permits alone. Permits show units authorized to enter the development pipeline. Housing-unit estimates show how the overall estimated stock changes after additions and losses are taken into account.
Used alongside construction, vacancy, affordability, population, and market data, housing-stock growth helps show where the physical supply base is expanding and how quickly that expansion differs across states.
Sources
- U.S. Census Bureau: National, State, and County Housing Unit Totals, 2020-2025
- U.S. Census Bureau: Population and Housing Unit Estimates Datasets
- U.S. Census Bureau: Vintage 2025 Housing Unit Release
- U.S. Census Bureau: Housing Unit Estimates Terms and Definitions
- U.S. Census Bureau: Population and Housing Unit Estimates Methodology
- U.S. Census Bureau: Annual Building Permits Data