Home Price-to-Income Ratio by State in 2026: U.S. Affordability Rankings
The home price-to-income ratio by state shows how expensive housing is relative to what households earn. In the latest nationwide Census data available in 2026, the differences are enormous.
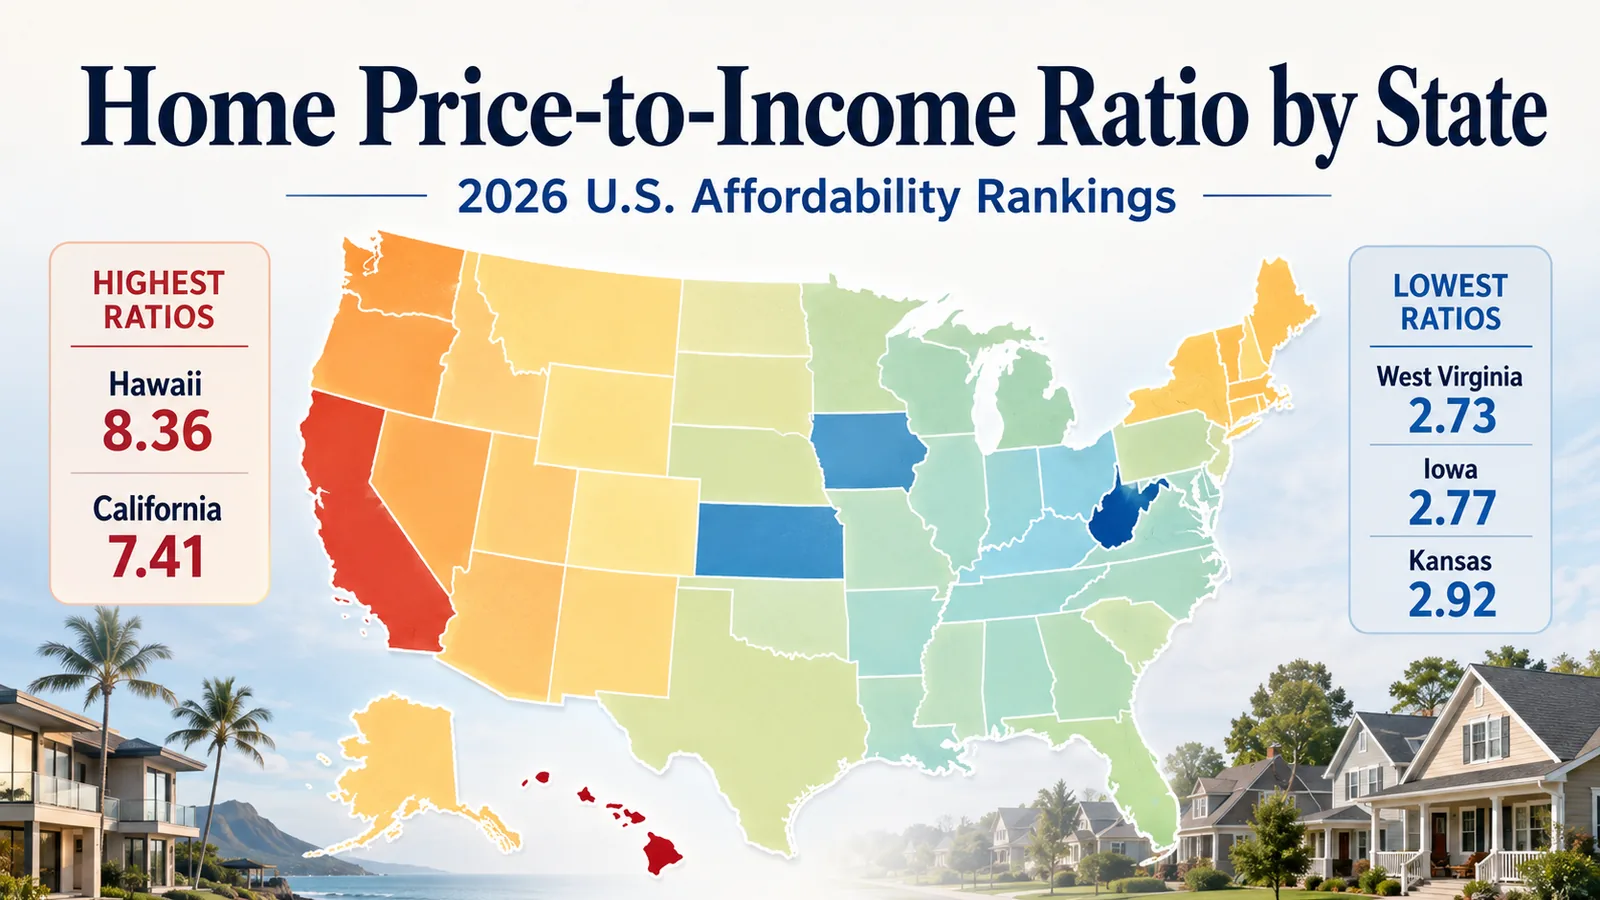
Hawaii has the highest ratio at 8.36, meaning the state’s median owner-occupied home value is more than eight times its median household income. California follows at 7.41.
At the other end of the ranking, West Virginia has the lowest ratio at 2.73, followed by Iowa at 2.77 and Kansas at 2.92.
Only three states fall below a ratio of 3.0 in this comparison.
That does not mean a household in West Virginia can automatically afford a home or that every household in Hawaii is priced out. Mortgage rates, down payments, insurance, property taxes, debt, local wages, and the specific city all matter.
But the ratio provides a useful way to compare the structural relationship between housing values and household income across the country.
Our Housing Affordability research looks at those broader factors when evaluating whether housing is realistically within reach.
Home Price-to-Income Ratio by State: 2026 Rankings
This ranking uses the latest consistent nationwide Census data available in 2026:
Median value of owner-occupied housing units, 2020–2024 ÷ median household income, 2020–2024
A ratio of 4.00 means the state’s median owner-occupied home value is approximately four times its median annual household income.
| Rank | State | Median Home Value | Median Household Income | Price-to-Income Ratio |
|---|---|---|---|---|
| 1 | Hawaii | $839,100 | $100,389 | 8.36 |
| 2 | California | $734,700 | $99,122 | 7.41 |
| 3 | Oregon | $477,600 | $83,011 | 5.75 |
| 4 | Washington | $564,600 | $98,141 | 5.75 |
| 5 | Colorado | $539,400 | $95,470 | 5.65 |
| 6 | Nevada | $435,400 | $78,260 | 5.56 |
| 7 | Massachusetts | $562,100 | $103,960 | 5.41 |
| 8 | Idaho | $418,600 | $77,800 | 5.38 |
| 9 | Montana | $375,800 | $72,509 | 5.18 |
| 10 | Utah | $489,400 | $95,166 | 5.14 |
| 11 | Arizona | $394,500 | $79,964 | 4.93 |
| 12 | New York | $423,800 | $85,974 | 4.93 |
| 13 | Florida | $359,000 | $74,568 | 4.81 |
| 14 | Rhode Island | $404,200 | $87,796 | 4.60 |
| 15 | New Jersey | $454,400 | $103,556 | 4.39 |
| 16 | Delaware | $352,000 | $84,954 | 4.14 |
| 17 | Tennessee | $286,700 | $69,595 | 4.12 |
| 18 | Virginia | $383,700 | $93,170 | 4.12 |
| 19 | Wyoming | $309,700 | $76,176 | 4.07 |
| 20 | New Hampshire | $402,500 | $99,031 | 4.06 |
| 21 | Maryland | $419,900 | $103,678 | 4.05 |
| 22 | North Carolina | $288,900 | $72,388 | 3.99 |
| 23 | Maine | $296,600 | $74,733 | 3.97 |
| 24 | Georgia | $303,300 | $77,353 | 3.92 |
| 25 | Vermont | $316,600 | $81,203 | 3.90 |
| 26 | New Mexico | $248,100 | $64,059 | 3.87 |
| 27 | Connecticut | $366,900 | $95,781 | 3.83 |
| 28 | Alaska | $352,900 | $92,788 | 3.80 |
| 29 | South Carolina | $259,000 | $69,324 | 3.74 |
| 30 | Minnesota | $329,300 | $89,062 | 3.70 |
| 31 | Texas | $283,800 | $78,476 | 3.62 |
| 32 | Louisiana | $216,500 | $60,756 | 3.56 |
| 33 | Wisconsin | $266,500 | $77,485 | 3.44 |
| 34 | South Dakota | $257,400 | $75,081 | 3.43 |
| 35 | Alabama | $209,900 | $63,999 | 3.28 |
| 36 | Pennsylvania | $254,500 | $77,971 | 3.26 |
| 37 | North Dakota | $249,900 | $76,657 | 3.26 |
| 38 | Missouri | $230,300 | $70,702 | 3.26 |
| 39 | Kentucky | $205,600 | $63,726 | 3.23 |
| 40 | Michigan | $231,600 | $72,875 | 3.18 |
| 41 | Illinois | $263,300 | $83,390 | 3.16 |
| 42 | Nebraska | $238,600 | $76,475 | 3.12 |
| 43 | Arkansas | $188,000 | $60,773 | 3.09 |
| 44 | Oklahoma | $199,800 | $65,039 | 3.07 |
| 45 | Indiana | $218,200 | $71,957 | 3.03 |
| 46 | Ohio | $214,800 | $71,389 | 3.01 |
| 47 | Mississippi | $169,800 | $56,447 | 3.01 |
| 48 | Kansas | $217,200 | $74,275 | 2.92 |
| 49 | Iowa | $208,000 | $75,059 | 2.77 |
| 50 | West Virginia | $162,600 | $59,608 | 2.73 |
The underlying housing-value figures come from the U.S. Census Bureau’s 2020–2024 housing estimates, while household income comes from the Census Bureau’s corresponding 2020–2024 household income estimates.
Where displayed ratios are tied after rounding to two decimal places, the ranking order follows the underlying unrounded calculation.
What Is a Home Price-to-Income Ratio?
A home price-to-income ratio compares the value or price of housing with annual household income.
The basic formula is:
Home value ÷ annual household income = price-to-income ratio
For example, if the typical home value is $400,000 and the median household income is $80,000:
$400,000 ÷ $80,000 = 5.0
Housing in that market is therefore valued at approximately five times annual median household income.
The ratio is useful because a $400,000 home does not have the same affordability implications everywhere.
In an area where the median household earns $150,000, that price may be relatively manageable.
In an area where the median household earns $60,000, the same home represents a much larger financial hurdle.
For broader location comparisons that include living expenses beyond housing, see our Cost of Living research.
The 10 States With the Highest Price-to-Income Ratios
The most stretched states in this ranking are:
| Rank | State | Ratio |
|---|---|---|
| 1 | Hawaii | 8.36 |
| 2 | California | 7.41 |
| 3 | Oregon | 5.75 |
| 4 | Washington | 5.75 |
| 5 | Colorado | 5.65 |
| 6 | Nevada | 5.56 |
| 7 | Massachusetts | 5.41 |
| 8 | Idaho | 5.38 |
| 9 | Montana | 5.18 |
| 10 | Utah | 5.14 |
Several patterns stand out.
Hawaii and California Are in a Separate Affordability Tier
Hawaii and California are the only states in this Census-based ranking above 7.0.
Hawaii’s median owner-occupied home value of $839,100 is more than eight times its median household income of $100,389.
California’s median home value of $734,700 is approximately 7.4 times its median household income of $99,122.
Both states have high incomes relative to much of the country.
The problem is that housing values are even higher.
High household income therefore does not automatically translate into strong housing affordability.
The West Dominates the High-Ratio Rankings
Nine of the top 10 states are in the West:
- Hawaii
- California
- Oregon
- Washington
- Colorado
- Nevada
- Idaho
- Montana
- Utah
Massachusetts is the sole regional exception.
This pattern reflects the large run-up in housing values experienced across coastal and Mountain West markets, where supply constraints, population shifts, and strong demand have often pushed prices faster than local incomes.
The result is that relatively high-income states such as Washington, Colorado, and Utah can still have elevated home price-to-income ratios.
High Income Does Not Guarantee Affordability
Massachusetts illustrates this point clearly.
Its median household income is $103,960, one of the highest in the country.
But its median owner-occupied home value is $562,100, producing a ratio of 5.41.
New Jersey offers a similar lesson.
Median household income is $103,556, yet the median home value is $454,400, producing a ratio of 4.39.
Affordability depends on the relationship between income and housing cost—not on income alone.
The 10 States With the Lowest Price-to-Income Ratios
The lowest ratios are concentrated largely in the Midwest and interior South.
| Rank | State | Ratio |
|---|---|---|
| 41 | Illinois | 3.16 |
| 42 | Nebraska | 3.12 |
| 43 | Arkansas | 3.09 |
| 44 | Oklahoma | 3.07 |
| 45 | Indiana | 3.03 |
| 46 | Ohio | 3.01 |
| 47 | Mississippi | 3.01 |
| 48 | Kansas | 2.92 |
| 49 | Iowa | 2.77 |
| 50 | West Virginia | 2.73 |
These states generally have much lower housing values than the national leaders.
West Virginia’s median owner-occupied home value is $162,600, compared with $839,100 in Hawaii.
Iowa combines a median home value of $208,000 with a median household income of $75,059, resulting in one of the strongest income-to-housing relationships in the country.
Kansas also falls below 3.0, with a median home value of $217,200 and a median household income of $74,275.
But a low ratio should not automatically be interpreted as the “best place to buy.”
Job opportunities, wage growth, population trends, property conditions, insurance, taxes, and local housing-market liquidity can all matter.
A location can have inexpensive housing partly because demand is weaker.
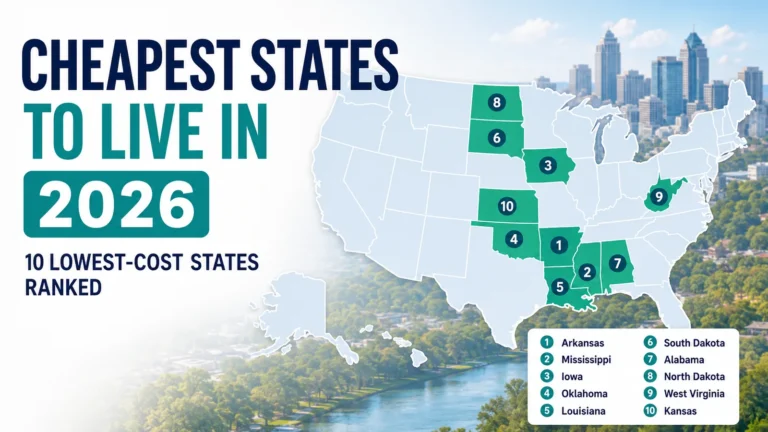
For a broader comparison of statewide prices beyond housing alone, see our Cheapest States to Live in 2026.
Only Three States Are Below a Ratio of 3.0
One of the most striking findings in the ranking is how uncommon a sub-3.0 ratio has become.
Only:
- West Virginia — 2.73
- Iowa — 2.77
- Kansas — 2.92
fall below that threshold.
Historically, a price-to-income ratio around 3 has often been used as a rough affordability benchmark.
That does not mean every ratio above 3 is unaffordable or every ratio below 3 is affordable.
The mortgage market, property taxes, insurance, and household finances have changed substantially over time.
But the scarcity of states below 3.0 illustrates how far housing values have moved relative to incomes across much of the country.
The National Affordability Problem Is Larger Than This State Ranking
The state table is only one way to measure the problem.
The Harvard Joint Center for Housing Studies’ State of the Nation’s Housing 2026 reports that the national median sales price of an existing single-family home was about 4.7 times median household income in 2025.
That was slightly below the all-time high of 5.0 reached in 2022, but still far above:
- 4.1 in 2019
- approximately 3.2 during the 1990s
Harvard’s measure is different from the Census-based state ranking in this article.
It uses national home sales prices and household income to examine the current homebuying market.
This ranking uses median values of owner-occupied homes and median household income from the same 2020–2024 Census dataset so that all 50 states can be compared consistently.
The two measures should therefore not be treated as interchangeable.
They point in the same broad direction: housing remains expensive relative to household income by historical standards.
Mortgage Rates Make the Ratio More Important, but Also Less Complete
A price-to-income ratio tells you how expensive a home is relative to income.
It does not tell you what the mortgage payment will be.
That distinction is especially important in 2026.
According to Freddie Mac’s mortgage-rate data, the average 30-year fixed mortgage rate was 6.66% on August 27, 2026.
At higher mortgage rates, the same home price produces a much larger monthly payment than it would at a 3% or 4% rate.
That means today’s buyer can face serious affordability pressure even in a state with a relatively moderate price-to-income ratio.
For example, two buyers purchasing identical $300,000 homes could have very different monthly costs depending on:
- Mortgage rate
- Down payment
- Credit profile
- Property taxes
- Homeowners insurance
- HOA fees
- Mortgage insurance
The ratio is therefore best viewed as a structural affordability indicator, not a mortgage calculator.
Property Taxes and Insurance Can Reverse Part of a State’s Advantage
A low home price-to-income ratio does not account for the ongoing cost of owning the property.
Texas is a useful example.
Its ratio in this ranking is 3.62, considerably below Florida’s 4.81.
Texas also has substantially lower statewide home values.
But Texas property taxes are generally higher than Florida’s, while insurance expenses can be substantial in both states.
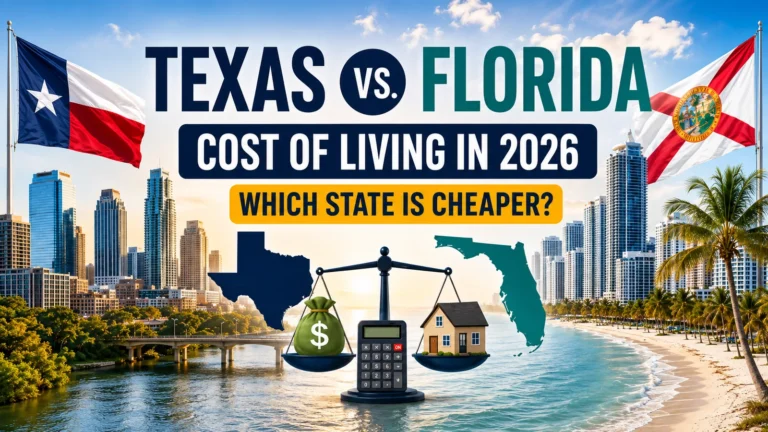
Our detailed Texas vs. Florida cost of living comparison shows why purchase price alone cannot determine which state is cheaper for a particular homeowner.
For a broader state-by-state comparison of those recurring ownership expenses, see our Home Insurance vs Property Taxes by State in 2026.
This is especially important in states exposed to:
- Hurricanes
- Wildfires
- Flooding
- Hail
- Severe storms
- Other climate-related risks
Insurance premiums can materially change the monthly cost of homeownership even when the purchase price appears affordable.
State Rankings Hide Huge Differences Between Cities
Statewide ratios are useful for understanding broad structural conditions.
They are not a substitute for local market analysis.
Texas ranks 31st in this table with a ratio of 3.62.
That does not mean Austin, Houston, Dallas, and San Antonio have identical affordability.
California’s statewide ratio of 7.41 similarly hides major differences among:
- San Francisco
- Los Angeles
- San Diego
- Sacramento
- Fresno
- Bakersfield
- Inland California markets
The same issue applies in every state.
A high-cost metropolitan area can sit inside an otherwise moderate state.
A lower-cost city can also exist inside a state with an elevated statewide ratio.
If you’re making a relocation or purchase decision, the analysis should become increasingly specific:
- State: statewide affordability conditions
- Metro area: regional housing market and employment conditions
- City: local prices and housing options
- Neighborhood: street-level housing and lifestyle differences
- Individual property: the actual home’s price and ownership costs
Our U.S. States and Housing Markets research are designed to move from national comparisons toward those more local market conditions.
For examples of metros combining growth with relatively accessible housing costs, see our Fast-Growing Affordable Metros in the U.S. for 2026.
What Does a Ratio of 5.0 Actually Mean for a Buyer?
Suppose a state’s median home value is $400,000 and its median household income is $80,000.
The ratio is:
$400,000 ÷ $80,000 = 5.0
That does not mean a household can buy the home by spending five years of income.
Households must also pay for:
- Food
- Transportation
- Taxes
- Health care
- Childcare
- Debt
- Utilities
- Insurance
- Retirement savings
- Other living expenses
Most buyers also finance homes rather than paying cash.
So a ratio of 5.0 is best interpreted as:
The typical housing value is five times the annual income of the median household.
As that multiple rises, buyers generally need a combination of:
- Larger down payments
- Higher-than-median income
- Dual incomes
- Lower debt
- Longer savings periods
- Smaller homes
- Less expensive locations
Is a Ratio Below 3.0 Automatically Affordable?
No.
West Virginia, Iowa, and Kansas have ratios below 3.0 in this ranking, but personal affordability still depends on the household.
A buyer earning well below the state median may struggle.
A household carrying substantial debt may qualify for less mortgage financing.
Property taxes and insurance may differ substantially from one county to another.
The condition and maintenance requirements of lower-priced housing also matter.
And a low-cost market may offer fewer employment opportunities in a buyer’s particular profession.
The ratio tells you how housing values compare with local income broadly.
It cannot tell you whether a particular household should buy a particular home.
Is a High Ratio Always Bad?
Not necessarily. A high ratio signals housing is expensive relative to income, but it does not explain why.
High-ratio markets can have:
- Strong employment centers
- Limited developable land
- Restrictive housing supply
- High population demand
- Geographic constraints
- Strong amenities
- High expected wages in specific occupations
- Long-term housing scarcity
Some households may willingly accept higher housing costs because the location offers career, family, or lifestyle advantages.
The problem arises when the housing market requires incomes far above what typical local households actually earn.
That can make homeownership increasingly dependent on:
- Existing wealth
- Large down payments
- Family assistance
- Equity from a prior home
- Above-average earnings
For a broader view that considers factors beyond housing affordability, see our Best States to Live in 2026.
How to Use This Ranking When Comparing States
The home price-to-income ratio is most useful as a screening tool.
If You’re Considering a Move
Use the ratio to identify states where housing values are relatively high or low compared with local household income.
Then compare:
- Expected salary
- Rent
- Home prices
- Property taxes
- Insurance
- Transportation
- State and local taxes
- Major metro differences
Do not move solely because one state ranks lower.
If You’re Planning to Buy
After identifying a state or metro, stop relying on statewide ratios and calculate the actual property.
Estimate:
Mortgage principal and interest + property taxes + homeowners insurance + HOA fees + other required housing costs
Then compare that monthly cost with your gross and net household income.
If You’re Comparing Investment or Market Conditions
A high price-to-income ratio can signal a market where prices have stretched far beyond local earnings.
But it is not, by itself, proof of a housing bubble.
Likewise, a low ratio does not automatically mean homes are undervalued.
Supply, employment growth, migration, construction, vacancy rates, and local demand all matter.
Methodology
This ranking uses the latest consistent Census data available nationwide as of August 2026.
Housing Value
The numerator is:
Median value of owner-occupied housing units, 2020–2024
Source: U.S. Census Bureau, American Community Survey
Household Income
The denominator is:
Median household income, 2020–2024, in 2024 dollars
Source: U.S. Census Bureau, American Community Survey
Formula
For each state:
Median owner-occupied home value ÷ median household income
Example for Texas:
$283,800 ÷ $78,476 = 3.62
Example for Hawaii:
$839,100 ÷ $100,389 = 8.36
Ratios are calculated from the underlying values and displayed to two decimal places. Where two states display the same rounded ratio, their ranking order follows the unrounded calculation.
What the Ranking Does Not Measure
The ratio does not include:
- Current mortgage rates
- Down payment
- Mortgage insurance
- Property taxes
- Homeowners insurance
- Flood insurance
- HOA fees
- Maintenance
- Closing costs
- Household debt
- Credit score
- City-level differences
- Neighborhood-level differences
It also does not use current asking prices or current monthly sale prices.
The numerator represents the Census estimate of the median value of existing owner-occupied homes during the 2020–2024 survey period.
That choice is intentional: it provides one consistent housing and income dataset for all 50 states instead of combining different years or incompatible measurements.
Frequently Asked Questions
Which state has the highest home price-to-income ratio?
Hawaii has the highest ratio in this ranking at 8.36, followed by California at 7.41. Housing values in both states are exceptionally high relative to median household income.
Which state has the lowest home price-to-income ratio?
West Virginia has the lowest ratio at 2.73, followed by Iowa at 2.77 and Kansas at 2.92.
What is a good home price-to-income ratio?
There is no universal cutoff for every household. A ratio around 3 has historically been used as a rough affordability reference, but mortgage rates, taxes, insurance, and personal finances determine what an individual buyer can actually afford.
How is the home price-to-income ratio calculated?
Divide the home value or price by annual household income. In this ranking, each state’s median owner-occupied home value is divided by its median household income using the same Census 2020–2024 dataset.
Why does this ranking differ from other state affordability rankings?
Different rankings may use Zillow home values, median sale prices, listing prices, older or newer income estimates, metropolitan rather than state data, or proprietary affordability formulas. This ranking uses one consistent Census dataset for both housing values and household income.
Is the home price-to-income ratio the same as housing affordability?
No. It is one measure of housing affordability. True buyer affordability also depends on mortgage rates, down payment, property taxes, homeowners insurance, debt, and other household expenses.
Does a low ratio mean I should move to that state?
Not necessarily. A lower ratio indicates housing values are lower relative to local income, but employment opportunities, taxes, insurance, climate risk, amenities, and the specific city should also be evaluated.
Why are Hawaii and California so high?
Both states combine very high housing values with household incomes that, although high nationally, have not risen enough to offset housing costs. Limited housing supply and strong demand in many markets contribute to the gap.
Where does Texas rank?
Texas ranks 31st in this state comparison with a ratio of 3.62, based on a median owner-occupied home value of $283,800 and median household income of $78,476.
Where does Florida rank?
Florida ranks 13th with a ratio of 4.81, based on a median owner-occupied home value of $359,000 and a median household income of $74,568.