Cheapest States to Live in 2026: 10 Lowest-Cost States
Finding the cheapest states to live in can make a major difference to a household budget, but “cheap” should be measured carefully.
Housing gets most of the attention, yet the cost of living also reflects what people pay for food, transportation, utilities, healthcare, recreation, and other goods and services.
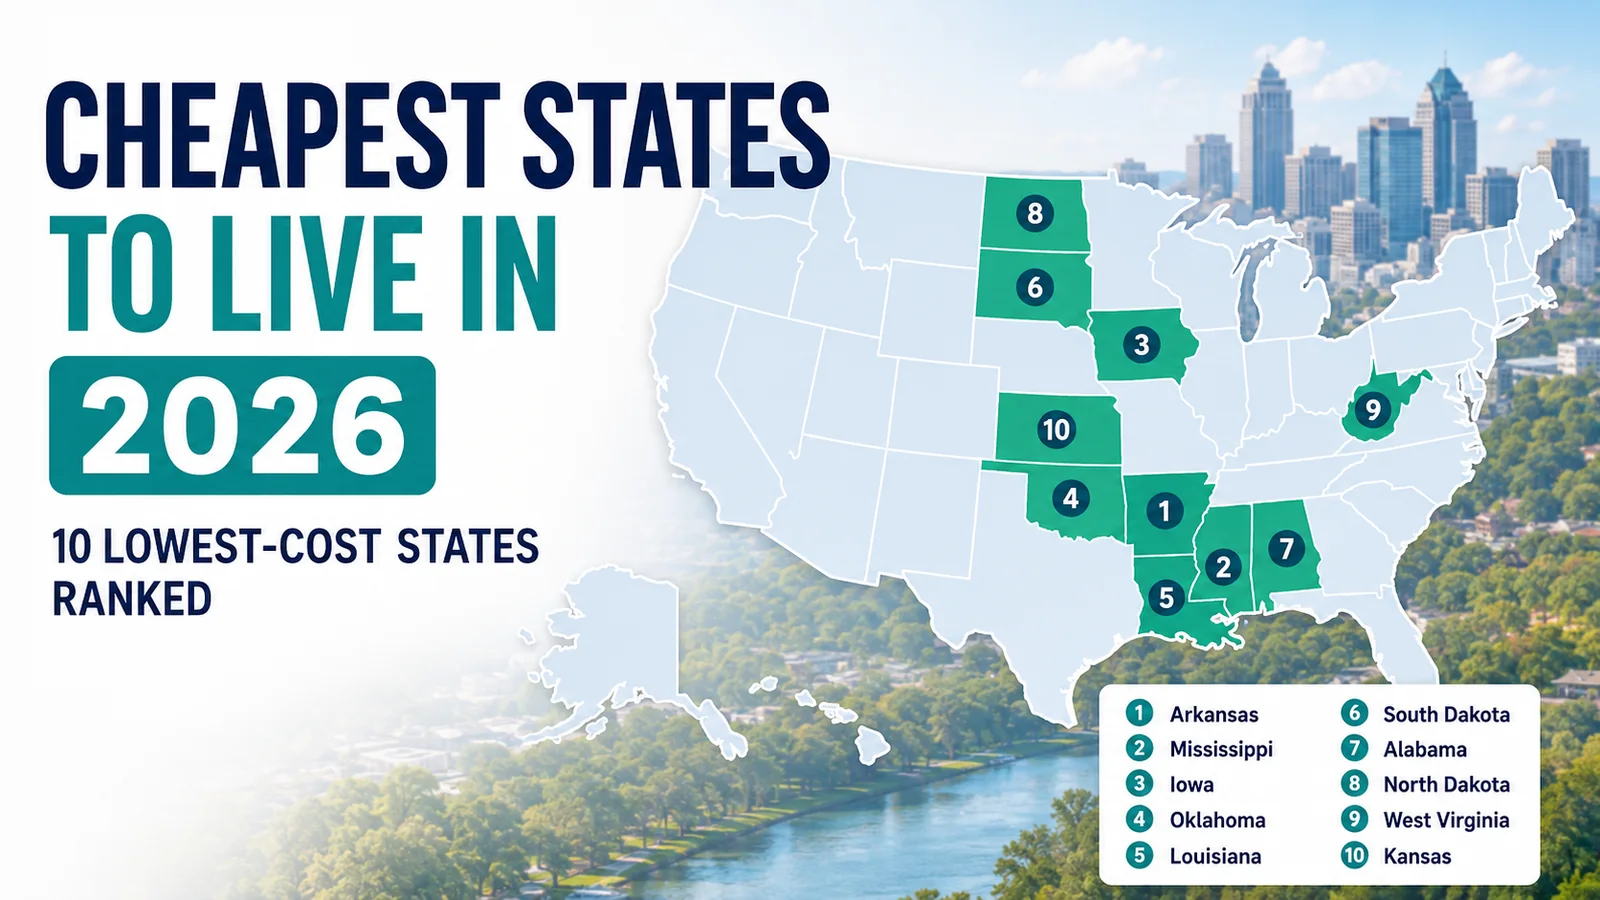
Using the latest federal Regional Price Parities from the U.S. Bureau of Economic Analysis (BEA), Arkansas and Mississippi have the lowest overall price levels in the country, followed by Iowa, Oklahoma, and Louisiana.
This 2026 ranking uses the latest BEA data currently available, which measure state price levels for 2024 and were released on February 19, 2026. BEA’s next annual release, covering 2025, is scheduled for December 10, 2026.
For broader state-by-state living-cost research, see our Cost of Living hub.
10 Cheapest States to Live in 2026
The ranking below uses BEA’s all-items Regional Price Parity, or RPP.
The U.S. average equals 100.
An RPP of 90 means the overall price level in that state is approximately 10% below the national average for the mix of goods and services measured by BEA.
| Rank | State | Overall RPP | Below U.S. Average | Housing-Rent RPP |
|---|---|---|---|---|
| 1 | Arkansas | 86.9 | 13.1% | 58.2 |
| 2 | Mississippi | 87.0 | 13.0% | 56.5 |
| 3 | Iowa | 87.8 | 12.2% | 65.3 |
| 4 | Oklahoma | 87.8 | 12.2% | 62.8 |
| 5 | Louisiana | 88.2 | 11.8% | 63.1 |
| 6 | South Dakota | 88.6 | 11.4% | 67.6 |
| 7 | Alabama | 88.8 | 11.2% | 61.8 |
| 8 | North Dakota | 89.0 | 11.0% | 71.4 |
| 9 | West Virginia | 89.5 | 10.5% | 54.2 |
| 10 | Kansas | 90.1 | 9.9% | 71.2 |
Source: U.S. Bureau of Economic Analysis — Regional Price Parities.
The housing-rent column is useful for context but does not determine the overall ranking. BEA’s all-items index includes a much broader range of consumer goods and services.
1. Arkansas
Arkansas has the lowest overall price level in the latest BEA data.
Its all-items RPP is 86.9. That means the state’s overall price level is approximately 13.1% below the U.S. average.
Arkansas also has a housing-rent RPP of approximately 58.2, indicating that rent prices for tenants are substantially below the national benchmark.
Housing is one of the main reasons lower-cost states can rank so favorably. BEA notes that differences in housing rents are often a major driver of regional price-level differences.
Arkansas narrowly ranks below Mississippi using the underlying unrounded data. However, the difference is extremely small, so households should not interpret the No. 1 versus No. 2 ranking as evidence that everyday costs are meaningfully different across every Arkansas and Mississippi community.
Local conditions matter far more when comparing individual cities.
2. Mississippi
Mississippi is essentially neck-and-neck with Arkansas. Its overall RPP is 87.0, or approximately 13.0% below the national average.
Mississippi’s housing-rent RPP is approximately 56.5, among the lowest in the country.
That helps explain why Mississippi consistently appears near the bottom of national cost-of-living rankings.
But lower statewide prices should not automatically be interpreted as greater financial well-being.
A household’s actual affordability depends on the relationship between:
- Income
- Housing costs
- Employment
- Taxes
- Insurance
- Transportation
- Household size
- Lifestyle
A state can be inexpensive while local wages are also relatively low.
That distinction becomes especially important when comparing places for relocation.
3. Iowa
Iowa ranks third with an overall RPP of 87.8. That places its overall price level approximately 12.2% below the U.S. average. Its housing-rent RPP is approximately 65.3.
Iowa’s ranking demonstrates that the lowest-cost states are not confined to the South.
Several Great Plains and Midwestern states also benefit from lower housing costs and generally moderate price levels compared with higher-cost coastal markets.
A household considering Iowa should still compare individual metros and smaller communities, because a statewide RPP is an average rather than the price level of every location within the state.
Our U.S. States research provides the broader framework for comparing states individually.
4. Oklahoma
Oklahoma follows extremely closely behind Iowa. Its overall RPP is 87.8, which is approximately 12.2% below the national average.
The difference between Iowa and Oklahoma is less than one-tenth of an index point when rounded to one decimal place.
Oklahoma’s housing-rent RPP is approximately 62.8.
That comparatively low housing component helps keep the state’s overall price level down.
For households primarily concerned about housing, however, statewide rent price levels should be only the beginning of the analysis.
Actual asking rents, home prices, and neighborhood costs can differ substantially between Oklahoma City, Tulsa, and smaller communities.
5. Louisiana
Louisiana’s overall RPP is 88.2. That makes its general price level approximately 11.8% below the U.S. average.
Its housing-rent RPP is approximately 63.1. Louisiana therefore remains one of America’s least expensive states in terms of overall consumer price levels.
But Louisiana is also a particularly relevant example of why cost-of-living rankings should not be treated as complete relocation recommendations.
A relatively low price level does not account for every expense a homeowner may encounter.
Property-specific homeowners insurance, flood exposure, and other housing risks can materially affect the real cost of owning a home.
For those considerations, see our Housing Risk research.
6. South Dakota
South Dakota ranks sixth. Its overall RPP is 88.6, or approximately 11.4% below the U.S. average. Its housing-rent RPP is 67.6.
South Dakota’s overall cost advantage is somewhat larger than its rent index alone might suggest.
That illustrates why it is better to use an all-items price measure for a general cost-of-living ranking rather than simply sorting states by rents or home prices.
A household budget includes far more than housing.
7. Alabama
Alabama has an overall RPP of 88.8. That puts its statewide price level approximately 11.2% below the U.S. average. Its housing-rent RPP is approximately 61.8.
Alabama combines low housing price levels with an overall cost structure that remains well below the national benchmark.
Still, the difference between living in Birmingham, Huntsville, Mobile, or a rural Alabama community can be substantial.
State rankings are useful for narrowing a relocation search, but city- and metro-level comparisons are necessary before making an actual move.
8. North Dakota
North Dakota ranks eighth with an overall RPP of 89.0. That is approximately 11.0% below the national average. Its housing-rent RPP is approximately 71.4.
North Dakota is notable because its rent price level is higher than those of many other states in the top 10, yet its overall price level remains comparatively low.
That is another reminder that housing is important but does not determine the entire cost-of-living ranking.
Prices for other goods and services also affect the all-items RPP.
9. West Virginia
West Virginia ranks ninth overall with an RPP of 89.5. That makes its general price level approximately 10.5% below the U.S. average.
But West Virginia stands out in one particular category. BEA reports a housing-rent RPP of 54.2.
That is the lowest statewide housing-rent price level in the country.
In other words, West Virginia does not have the lowest overall cost of living, but its measured tenant-rent price level is exceptionally low compared with the national benchmark.
This illustrates why households should distinguish between the overall cost of living and housing cost alone.
The answer to “Which state is cheapest?” can change depending on the expense being measured.
10. Kansas
Kansas completes the top 10. Its overall RPP is 90.1. This means that Kansas’s statewide price level is approximately 9.9% below the U.S. average. Its housing-rent RPP is approximately 71.2.
Kansas therefore sits just above the 90-point threshold, with an underlying 2024 RPP of approximately 90.07 that rounds to 90.1 at one decimal place.
Like Iowa and the Dakotas, Kansas demonstrates the cost advantage found across parts of the Great Plains.
What Regional Price Parities Actually Measure
Regional Price Parities, or RPPs, are federal spatial price indexes produced by the U.S. Bureau of Economic Analysis.
BEA sets the national price level at 100. Each state’s index shows how its average price level compares with the country as a whole.
According to BEA’s technical methodology, RPPs use price information covering a wide range of categories, including:
- Food
- Apparel
- Housing
- Medical services
- Education
- Recreation
- Transportation
- Other goods and services
Housing-rent information comes from the U.S. Census Bureau’s American Community Survey.
The result is designed to compare price levels between places rather than simply looking at the price of one product, such as a house.
Why This Ranking Uses BEA Data Instead of a Private Cost-of-Living Index
Different websites can produce very different lists of the cheapest states.
That is usually because they are answering different questions.
One ranking may emphasize:
- Home prices
- Rent
- Minimum living-wage estimates
- Taxes
- Household income
- Utilities
- Groceries
- Childcare
Another may combine several private datasets into a proprietary score.
Those approaches can be useful for their specific purposes, but the resulting rankings are not directly comparable.
This ranking uses BEA’s all-items RPP as a single, transparent federal price-level measure.
That allows every state to be compared using the same methodology without creating an arbitrary custom weighting system.
Why “Cheapest” and “Most Affordable” Are Not the Same Thing
This distinction is critical.
Cost of living asks: How expensive are goods and services in a place?
Affordability asks: How manageable are those costs relative to household resources?
A state can have low prices but also lower wages. Another state may have higher prices but substantially higher household incomes.
That means the cheapest state is not automatically the one where every household will be financially better off.
For housing specifically, our Housing Affordability research looks beyond prices alone.
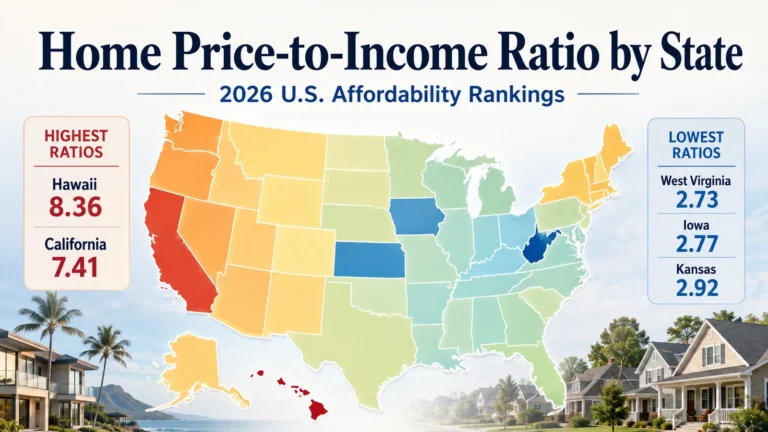
Our home price-to-income ratio by state comparison provides another way to see how housing values relate to local household earnings.
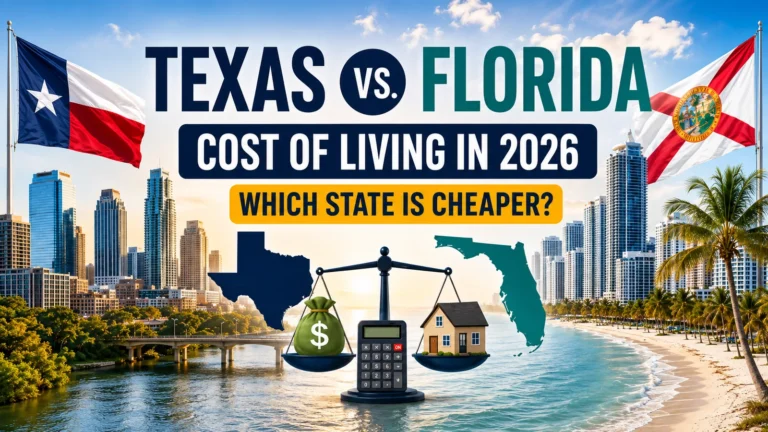
Those tradeoffs can also matter when comparing higher-profile relocation destinations. Our Texas vs. Florida cost of living comparison looks at housing, rent, taxes, insurance, and income across the two states.
A proper relocation comparison should consider both sides of the equation: what a household will spend and what it can earn.
Housing Is a Major Reason Cost of Living Differs by State
BEA specifically notes that housing rents are often a major driver of regional price differences.
The top 10 demonstrate that clearly. All have statewide housing-rent RPPs well below the national benchmark.
West Virginia’s rent RPP is only about 54.2, while Mississippi and Arkansas are also below 60.
But rent is not identical to:
- Current asking rent
- Mortgage payments
- Home sale prices
- Property taxes
- Homeowners insurance
BEA’s housing-rent RPP measures relative tenant-rent price levels within its methodology.
It should therefore not be used as though it were a current asking-rent figure or a home-price index.
Low Cost of Living Does Not Guarantee Cheap Homeownership
Rent and ownership costs can behave differently.
A homeowner may face:
- Mortgage interest
- Property taxes
- Homeowners insurance
- Maintenance
- HOA fees
- Hazard-specific insurance
- Major repairs
Those expenses can materially alter the attractiveness of a low-cost state.
For example, a household considering a lower-priced housing market may discover that insurance or property taxes consume part of the apparent savings.
Our Home Insurance vs Property Taxes by State in 2026 comparison shows how differently those two recurring ownership costs can behave across states.
That is why our Compare Places research evaluates multiple cost categories rather than relying on one headline statistic.
Statewide Rankings Can Hide Large Local Differences
Another important limitation is geography.
A state price level is an average. It does not mean every city within that state has the same cost structure.
Housing and everyday expenses can differ between:
- Major metros
- Suburbs
- Small cities
- College towns
- Rural areas
- Resort and tourism markets
Someone relocating to Arkansas should not assume that every Arkansas community is exactly 13.1% cheaper than every U.S. community.
The RPP comparison reflects the average statewide price level, but actual living costs can vary significantly within each state.
For relocation decisions, the analysis should become more specific at each stage:
- State: overall cost and economic environment
- Metro area: regional housing market and job conditions
- City: local prices, services, and amenities
- Neighborhood: street-level lifestyle and housing differences
- Individual housing option: the actual property-level cost and suitability
Migration popularity should also be considered separately from price. Our analysis of where Americans are moving in 2026 shows that some of the states attracting the most residents are not among the country’s lowest-cost states.
For households considering a move, our Relocation hub covers the broader decision process.
What Else Should You Compare Before Moving to a Low-Cost State?
Cost of living should be one part of a relocation decision, not the entire decision.
Before moving, compare the following:
Employment and Income
Lower prices provide less benefit if the move substantially reduces household income.
Remote workers and retirees may experience this tradeoff differently from workers dependent on the local labor market.
Housing Availability
A state may look inexpensive overall, while the specific metro or neighborhood you want has limited inventory.
Taxes
RPP is a consumer price-level measure, not a comprehensive state-and-local tax-burden ranking.
Compare the taxes relevant to your household.
Homeowners Insurance
Insurance costs can vary dramatically by state and individual property.
Transportation
A lower-cost home may require longer commuting distances or greater dependence on a vehicle.
Healthcare
Availability, insurance networks, and out-of-pocket costs can matter as much as headline price levels for some households.
Climate and Housing Risk
Floods, wildfires, hurricanes, severe weather, and other hazards can affect both lifestyle and long-term ownership costs.
Quality of Life
Schools, healthcare access, recreation, climate, family proximity, and community preferences cannot be reduced to a cost-of-living index.
For a broader comparison that incorporates several non-cost measures, see our Best States to Live in 2026.
Which Cheap State Is Best for You?
There is no universally correct answer.
If the objective is simply to find the lowest overall statewide price level, Arkansas and Mississippi are the leaders in the latest federal data.
If housing rent is the priority, West Virginia’s exceptionally low housing-rent RPP deserves attention.
If you prefer the Great Plains, Iowa, South Dakota, North Dakota, and Kansas all rank among the 10 lowest-cost states.
If you are considering the South, Arkansas, Mississippi, Oklahoma, Louisiana, and Alabama all offer overall price levels at least 11% below the national average.
The best choice depends on the household.
Someone working remotely may prioritize housing cost and broadband access.
A retiree may care more about healthcare, taxes, and climate.
A family may prioritize schools, employment, and housing space.
The ranking is therefore best used as a starting point for deeper research, not as a recommendation to move to the No. 1 state.
Conclusion
The cheapest states to live in are concentrated largely in the South, Midwest, and Great Plains.
Using the latest available BEA Regional Price Parities, the 10 lowest-cost states are:
- Arkansas
- Mississippi
- Iowa
- Oklahoma
- Louisiana
- South Dakota
- Alabama
- North Dakota
- West Virginia
- Kansas
Arkansas and Mississippi have overall price levels roughly 13% below the U.S. average, while every state in the top 10 is about 10% below the national benchmark.
Housing plays a major role, but the ranking also demonstrates why home prices or rents alone do not define the cost of living.
For households considering relocation, the strongest approach is to combine statewide price levels with local housing costs, income potential, taxes, insurance, employment, and lifestyle needs.
A cheaper state can stretch a household budget further.
Whether it is the right state depends on household income, where the household plans to live, and which costs matter most.
Methodology and Sources
The primary ranking uses the U.S. Bureau of Economic Analysis 2024 all-items Regional Price Parities, released on February 19, 2026.
Current RPP data and documentation:
U.S. Bureau of Economic Analysis: Regional Price Parities by State and Metro Area
Methodology:
U.S. Bureau of Economic Analysis: Technical Notes on Regional Price Parities
The U.S. average is set at 100. States below 100 have lower overall price levels than the national average.
The housing-rent RPP figures shown here measure the relative price level of observed tenant rents. They should not be interpreted as current asking rents, mortgage payments, or home values.
The District of Columbia is not included because this ranking covers the 50 states.
The latest available statewide RPP observations cover 2024. They are used in this 2026 article because BEA released those statistics in February 2026. BEA’s next scheduled release, covering 2025, is December 10, 2026.
Because Arkansas and Mississippi are separated by only a very small difference in the underlying RPP series, readers should treat them as effectively near parity rather than assuming that Arkansas is meaningfully cheaper for every household.
Frequently Asked Questions
What is the cheapest state to live in?
Arkansas has the lowest overall Regional Price Parity in BEA’s latest statewide data, narrowly ahead of Mississippi. The difference between the two states is extremely small.
What are the 10 cheapest states to live in?
Using BEA’s latest all-items Regional Price Parities, the 10 lowest-cost states are Arkansas, Mississippi, Iowa, Oklahoma, Louisiana, South Dakota, Alabama, North Dakota, West Virginia, and Kansas.
Which state has the lowest housing rent price level?
West Virginia has the lowest statewide housing-rent RPP, at approximately 54.2, according to BEA’s latest data.
Does a low RPP mean everything in a state is cheaper?
No. RPP represents an overall average price level across a broad mix of goods and services. Individual expenses can differ substantially.
Is the cheapest state also the most affordable state?
Not necessarily. Cost of living measures prices, while affordability also depends on income and household resources.
Are these 2026 cost-of-living data?
The ranking is current for 2026, but the underlying BEA Regional Price Parities cover 2024. Those are the latest statewide RPP data currently available and were released in February 2026.
Why not rank states by home prices alone?
Home prices measure only one part of household costs. BEA’s all-items RPP captures a broader range of goods and services, making it more appropriate for a general cost-of-living ranking.
Should I move to the cheapest state?
Not solely because of its ranking. Compare employment, income, housing, taxes, insurance, healthcare, climate, schools, and other household priorities before deciding where to live.