Average Rent by State in 2026: All 50 States Ranked
Average rent by state varies by more than $2,000 a month in 2026, making location one of the biggest factors in a renter’s housing budget. This ranking compares all 50 states using a consistent measure: the average monthly rent for a one-bedroom apartment, based on Apartments.com rent-trend data provided by CoStar Group for August 2026.
The national average for a one-bedroom apartment is $1,664 per month. Among the states, New York is the most expensive at $3,095 per month, while Oklahoma is the least expensive at $920. That $2,175 monthly gap equals about $26,100 over a year before utilities, fees, moving costs, or other housing expenses.
Use this ranking as a starting point, not a complete affordability score. A lower statewide rent can still hide expensive metro areas, and a higher-rent state may offer stronger wages, transit access, or other advantages. For a broader geographic comparison, explore the U.S. States hub.
Average Rent by State in 2026: 50-State Ranking
The table below ranks states from the highest to the lowest average one-bedroom apartment rent. The figures are a current-market snapshot from Apartments.com and CoStar Group for August 2026. The District of Columbia appears separately because it is not a state.
| Rank | State | Average one-bedroom rent | Average size |
|---|---|---|---|
| 1 | New York | $3,095/month | 602 sq ft |
| 2 | Massachusetts | $2,591/month | 715 sq ft |
| 3 | California | $2,266/month | 651 sq ft |
| 4 | New Jersey | $2,143/month | 726 sq ft |
| 5 | Connecticut | $1,925/month | 729 sq ft |
| 6 | New Hampshire | $1,894/month | 650 sq ft |
| 7 | Rhode Island | $1,890/month | 721 sq ft |
| 8 | Washington | $1,860/month | 668 sq ft |
| 9 | Hawaii | $1,842/month | 469 sq ft |
| 10 | Vermont | $1,828/month | 697 sq ft |
| 11 | Virginia | $1,813/month | 726 sq ft |
| 12 | Maine | $1,747/month | 642 sq ft |
| 13 | Illinois | $1,738/month | 677 sq ft |
| 14 | Florida | $1,695/month | 730 sq ft |
| 15 | Maryland | $1,682/month | 731 sq ft |
| 16 | Colorado | $1,577/month | 700 sq ft |
| 17 | Pennsylvania | $1,573/month | 695 sq ft |
| 18 | Delaware | $1,542/month | 743 sq ft |
| 19 | Oregon | $1,478/month | 653 sq ft |
| 20 | Georgia | $1,442/month | 766 sq ft |
| 21 | Montana | $1,434/month | 626 sq ft |
| 22 | Idaho | $1,420/month | 696 sq ft |
| 23 | South Carolina | $1,417/month | 744 sq ft |
| 24 | Utah | $1,393/month | 691 sq ft |
| 25 | Minnesota | $1,366/month | 703 sq ft |
| 26 | Tennessee | $1,365/month | 725 sq ft |
| 27 | North Carolina | $1,363/month | 746 sq ft |
| 28 | Nevada | $1,343/month | 706 sq ft |
| 29 | Alaska | $1,337/month | 612 sq ft |
| 30 | Arizona | $1,326/month | 682 sq ft |
| 31 | Wisconsin | $1,286/month | 713 sq ft |
| 32 | Wyoming | $1,254/month | 639 sq ft |
| 33 | Texas | $1,245/month | 714 sq ft |
| 34 | New Mexico | $1,194/month | 670 sq ft |
| 35 | Michigan | $1,173/month | 704 sq ft |
| 36 | Missouri | $1,169/month | 694 sq ft |
| 37 | Indiana | $1,138/month | 706 sq ft |
| 38 | Nebraska | $1,119/month | 731 sq ft |
| 39 | Ohio | $1,114/month | 669 sq ft |
| 40 | Kansas | $1,112/month | 705 sq ft |
| 41 | Kentucky | $1,092/month | 696 sq ft |
| 42 | Louisiana | $1,072/month | 703 sq ft |
| 43 | Alabama | $1,069/month | 734 sq ft |
| 44 | Mississippi | $1,025/month | 713 sq ft |
| 45 | South Dakota | $1,008/month | 689 sq ft |
| 46 | Iowa | $996/month | 659 sq ft |
| 47 | North Dakota | $986/month | 690 sq ft |
| 48 | West Virginia | $973/month | 661 sq ft |
| 49 | Arkansas | $968/month | 666 sq ft |
| 50 | Oklahoma | $920/month | 689 sq ft |
District of Columbia: $2,286 per month for an average one-bedroom apartment, with an average size of 687 square feet. If it were included in the state ranking, it would fall between Massachusetts and California.
Only 15 states have an average one-bedroom rent above the $1,664 national average, while 35 fall below it. The spread is substantial. New York’s statewide average is more than three times Oklahoma’s, which shows why a national rent figure can be a poor proxy for what a renter will face in a specific state.
States With the Cheapest Average Rent
The average rent by state data shows that the lowest-rent markets cluster mostly in the South and central United States.
10 cheapest states to rent in 2026
| Rank among cheapest | State | Average one-bedroom rent |
|---|---|---|
| 1 | Oklahoma | $920/month |
| 2 | Arkansas | $968/month |
| 3 | West Virginia | $973/month |
| 4 | North Dakota | $986/month |
| 5 | Iowa | $996/month |
| 6 | South Dakota | $1,008/month |
| 7 | Mississippi | $1,025/month |
| 8 | Alabama | $1,069/month |
| 9 | Louisiana | $1,072/month |
| 10 | Kentucky | $1,092/month |
Oklahoma stands out at $920 per month, about 45 percent below the national one-bedroom average. Arkansas and West Virginia are also below $1,000, as are North Dakota and Iowa.
The lower statewide figures do not mean every local market is inexpensive. Rents can vary sharply between college towns, fast-growing metros, resort areas, and smaller communities within the same state. Renters comparing relocation options should check the specific city or metro after narrowing the state-level shortlist.
For a broader view that includes groceries, transportation, utilities and other household costs, compare these results with our cost of living research.
States With the Highest Average Rent
The most expensive rental markets are concentrated in the Northeast and on the West Coast, although Hawaii and Washington also appear near the top.
10 most expensive states to rent in 2026
| Rank | State | Average one-bedroom rent |
|---|---|---|
| 1 | New York | $3,095/month |
| 2 | Massachusetts | $2,591/month |
| 3 | California | $2,266/month |
| 4 | New Jersey | $2,143/month |
| 5 | Connecticut | $1,925/month |
| 6 | New Hampshire | $1,894/month |
| 7 | Rhode Island | $1,890/month |
| 8 | Washington | $1,860/month |
| 9 | Hawaii | $1,842/month |
| 10 | Vermont | $1,828/month |
New York is the only state above $3,000 per month in this dataset. Massachusetts follows at $2,591, and California ranks third at $2,266. New Jersey is also above $2,000.
The Northeast is especially prominent. New York, New Jersey and all six New England states rank within the 12 most expensive states. Maine, the least expensive of the six New England states in this ranking, still averages $1,747 per month.
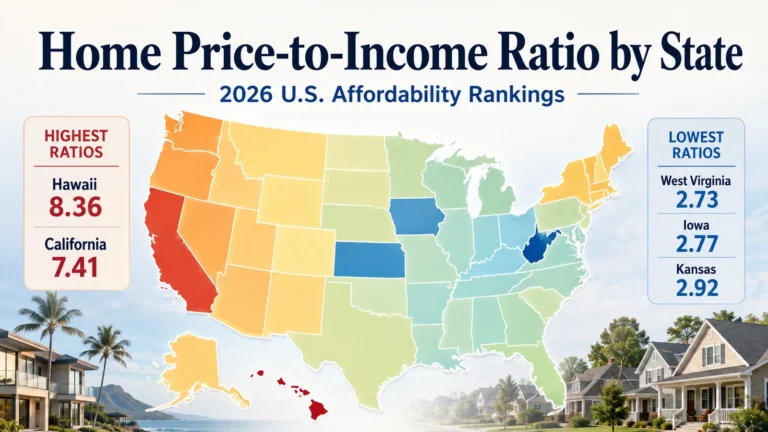
Higher rent does not automatically mean a state is less affordable for every household. Income, taxes, transportation, unit size and housing supply also affect the real burden. Renters who may eventually buy should compare rental costs with the home price-to-income ratio by state before treating rent alone as a long-term housing decision.
How Average Rent Differs Across U.S. Regions
Using one consistent apartment type keeps this average rent by state comparison more reliable across all 50 states.
The Northeast is generally the most expensive region for renters. New York, Massachusetts, New Jersey, Connecticut, New Hampshire, Rhode Island, and Vermont all rank in the top 10. Maine ranks 12th.
The Midwest is mostly below the national average. Illinois is the major exception, ranking 13th at $1,738 per month. Minnesota, Wisconsin, Michigan, Missouri, Indiana, Nebraska, Ohio, Kansas, Iowa, North Dakota, and South Dakota all fall below the national one-bedroom average.
The South has a wide range. Virginia and Florida sit above the national average, while many of the lowest-rent states are in the South, including Oklahoma, Arkansas, West Virginia, Mississippi, Alabama, Louisiana, and Kentucky.
The West is split. California and Washington are among the 10 most expensive states, while Oregon and Colorado sit closer to the middle. Arizona, Nevada, Utah, Idaho, Wyoming, and Alaska have lower statewide one-bedroom averages than the national figure.
These patterns can help narrow a relocation search, but statewide averages should not replace local research. A renter moving to a major coastal metro may face a very different market from someone choosing a smaller city in the same state.
What “Average Rent” Means in This Ranking
This article uses the Apartments.com and CoStar Group market-trend measure shown as each state’s average rent. On the state trend pages, that headline figure corresponds to the average monthly rent for a one-bedroom apartment.
That definition matters because “rent” is not one universal statistic. A studio, one-bedroom, two-bedroom, and single-family rental can have very different prices. The national Apartments.com figures for August 2026 illustrate the gap: the one-bedroom average is $1,664 per month, while the two-bedroom average is $1,931 and the three-bedroom average is $2,421.
Using one apartment type for all 50 states makes the ranking internally consistent. It does not mean $1,664 is the average cost of every rental unit in the country.
The table also includes average one-bedroom square footage. Size varies from 469 square feet in Hawaii to more than 740 square feet in several states, so two states with similar rent can offer different amounts of space.
Why Rent Data Can Differ by Source
Rent statistics can look contradictory when the underlying sources measure different things. That does not necessarily mean one source is wrong.
Average one-bedroom rent
Apartments.com states that its rent data is provided by CoStar Group’s Market Trend reports and combined with public records. This article uses the one-bedroom state averages as the primary ranking dataset.
Zillow’s typical asking rent
Zillow’s Observed Rent Index, or ZORI, measures a different concept. Zillow describes ZORI as a smoothed measure of the typical observed market rent, weighted to the rental housing stock. It covers a broader rental universe than a one-bedroom-only ranking.
For example, Zillow reported a typical U.S. asking rent of $1,962 in July 2026. That figure should not be compared directly with the $1,664 Apartments.com one-bedroom average as though the two statistics measure the same set of homes.
Census median gross rent
The U.S. Census Bureau’s American Community Survey uses another definition. Table B25064 measures median gross rent for renter-occupied housing units paying cash rent. Census defines gross rent as contract rent plus estimated monthly utilities and fuels when the renter pays those costs separately.
The latest ACS one-year table currently available is for 2024, so it also reflects a different time from a current 2026 rental-market snapshot.
HUD Fair Market Rent
HUD Fair Market Rents serve housing-program and policy purposes. HUD generally sets FMRs around the 40th percentile of rents for standard-quality units occupied by recent movers, subject to its methodology and geographic rules.
An FMR is therefore not the same thing as an average current-market rent. Renters should match the statistic to the question they are trying to answer.
What Renters Should Compare Beyond Monthly Rent
A state-level rent ranking is useful for screening locations, but monthly rent is only one part of the decision.
Consider these factors before moving:
Local market variation
State averages can hide costly metros and very affordable smaller cities. Compare the city, county, or metro where you would actually live.
Apartment size
A lower monthly rent may come with less space. Compare square footage and bedroom count rather than price alone.
Utilities and recurring fees
Electricity, heating, water, parking, trash, pet fees and amenity charges can materially change the monthly housing cost.
Rental concessions
A property may advertise one or two free months, a reduced deposit, or another incentive. Compare the effective cost over the full lease term, not only the advertised starting rent.
Income and job opportunities
A more expensive rental market can still be manageable when local wages are higher. Conversely, low rent does not guarantee strong affordability if income is also low.
Transportation
A cheaper apartment can cost more overall if it requires a long commute, multiple vehicles or expensive parking.
Long-term housing plans
Renters who expect to buy later should evaluate home prices and ownership costs in addition to current rent.
The best relocation decision combines rent with income, taxes, transportation, insurance, local housing supply, and lifestyle needs.
This average rent by state comparison works best as a starting point for narrowing your relocation or rental search.
Frequently Asked Questions
What state has the cheapest average rent in 2026?
Oklahoma has the lowest average one-bedroom apartment rent among the 50 states in the August 2026 Apartments.com and CoStar Group data, at $920 per month. Arkansas ranks second at $968, followed by West Virginia at $973.
What state has the highest average rent in 2026?
New York has the highest statewide average one-bedroom apartment rent at $3,095 per month. Massachusetts ranks second at $2,591, followed by California at $2,266.
What is the average rent in the United States in 2026?
Apartments.com reports a national average of $1,664 per month for a one-bedroom apartment in August 2026. Other sources can report different national rent figures because they use different property types, samples and methodologies.
Why is Zillow’s rent figure higher than the average in this ranking?
Zillow’s ZORI measures typical market rent across a broader rental housing stock, while this Real Estate Lynx ranking uses a one-bedroom apartment average from Apartments.com and CoStar Group. The two metrics answer different questions and should not be treated as interchangeable.
Is average rent the same as Census median gross rent?
No. An average and a median are different statistical measures, and Census gross rent also includes estimated utility and fuel costs when renters pay them separately. Census ACS data also cover renter-occupied housing rather than only a current-market one-bedroom apartment snapshot.
Why is Washington, D.C., not in the 50-state ranking?
The District of Columbia is not a state, so it is excluded from the 50-state ranking. Its August 2026 average one-bedroom rent is $2,286 per month, which would place it between Massachusetts and California if it were included.
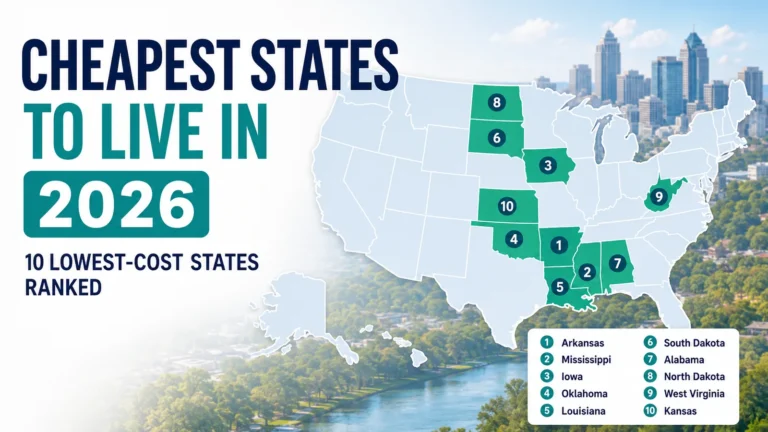
Rent is only one part of overall affordability. If you are comparing low-cost destinations for a move, continue with our ranking of the Cheapest States to Live in 2026 to compare broader living costs beyond housing.